The Federal Reserve spoke on Wednesday and announced a further dovish tone. Banking stocks, from large commercial banks to investment banks and regionals, didn’t like the sound of this and traded off, i.e. meaningfully lower. Regions Financial (NYSE:RF) finished the day lower by more than 4.3% and through the lens of technical analysis RF stock now looks to have further to fall. This sets up a trade for active investors and traders.
At the margin, when the Federal Reserve cuts interest rates or at least signals it will not hike them, banking stocks don’t fare very well. That’s because a flattening of the yield curve will in turn lead to lower net interest margins for banks. So when the Fed further solidified their dovish tone yesterday, the financial sector of stocks took a nosedive.
Before looking at the below charts for this bearish trade idea in RF stock, allow me to be clear that I my prognosis is not for a larger demise of financial institution stocks but rather on more near-term downside from a momentum and charting perspective.
RF Stock Charts
Click to Enlarge
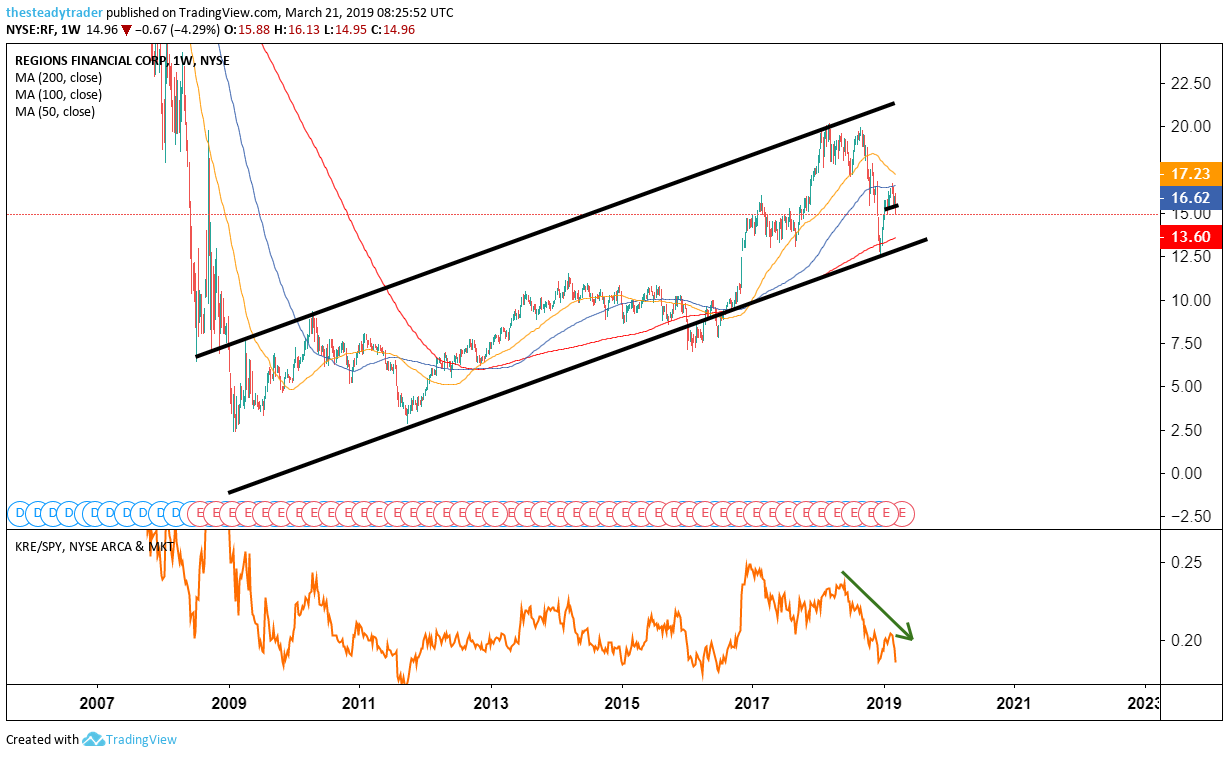
Moving averages legend: red – 200 week, blue – 100 week, yellow – 50 week
Starting off with the multiyear weekly chart, we see that RF stock had had an orderly incline over the years, which hit its zenith in March 2018. Through the lens of technical analysis, it then reached the very upper end of the up-trending range.
After marking an important lower high in September 2018, the stock accelerated lower into the late 2018 lows. In January and February, RF stock rallied strongly along with the broader market (no surprise there), but by late February/early March encountered fresh buyer exhaustion. Those recent highs may in retrospect end up being another lower high.
Click to Enlarge
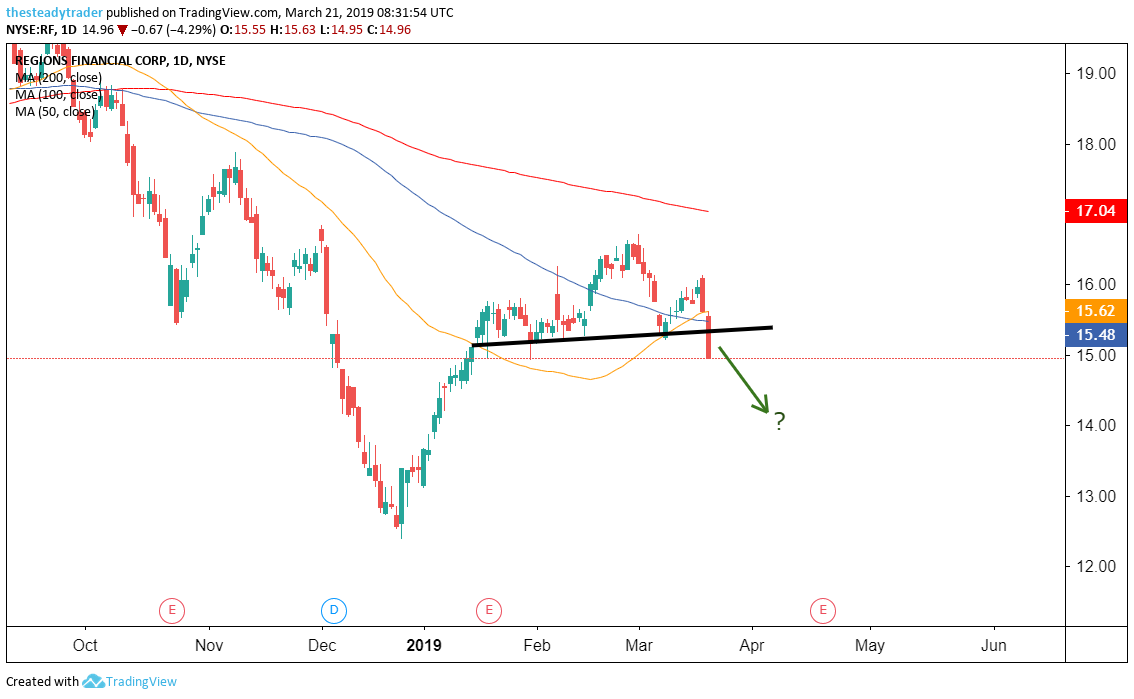
Moving averages legend: red – 200 day, blue – 100 day, yellow – 50 day
On the daily chart, we see that RF stock since the second half of January traced out a so-called head and shoulders pattern on the chart, which by definition is a bearish development, at least for a trade.
As a result of the post-FOMC statement sell-off in the stock on Wednesday, the stock “triggered” this pattern as it broke below the neckline (black horizontal). While the stock from here could certainly bounce a little in the immediate term, momentum now points the stock lower toward a next downside target around the $14 area. Any push back above $15.50 would be a stop loss trigger.
This trade also sets up beautifully for an income trade using options.
On Thursday, I am holding a special webinar for InvestorPlace readers to teach this strategy in detail. Register HERE for this free webinar. This is the highest-probability trading strategy I know of and have used for 18 years now.
Free webinar: How to 5X your returns in 2019. Register HERE.