Although the healthcare sector of the S&P 500 is still higher by a little more than 3% for the year, year-to-date it is the worst performing sector of the index. Within this space, shares of health insurance companies such as UnitedHealth (NYSE:UNH) have fared worse than the average stock in the sector but are now reaching record-setting oversold readings. As such, active traders and investors could look for a counter-trend trade setup in UNH stock.

A cornerstone of my market analysis approach is closely monitoring sector and group rotation. After all, money is always looking to find the best place to be, meaning the sector and group rotation within the stock market never stops. This also means that from a market participant’s perspective, playing sector and group rotation is one of the very few strategies that stands a good chance of being profitable in bull, bear or sideways markets.
Before looking at the charts it is important to highlight that the healthcare sector as per my Market Rover dashboard tool is currently both short- and medium-term bearish, yet it remains bullish in the longer term. In that vein, the bullish trade idea we are looking at today is a so-called “counter-trend” trade … and it’s not one that I’m looking to overstay my welcome in for the time being.
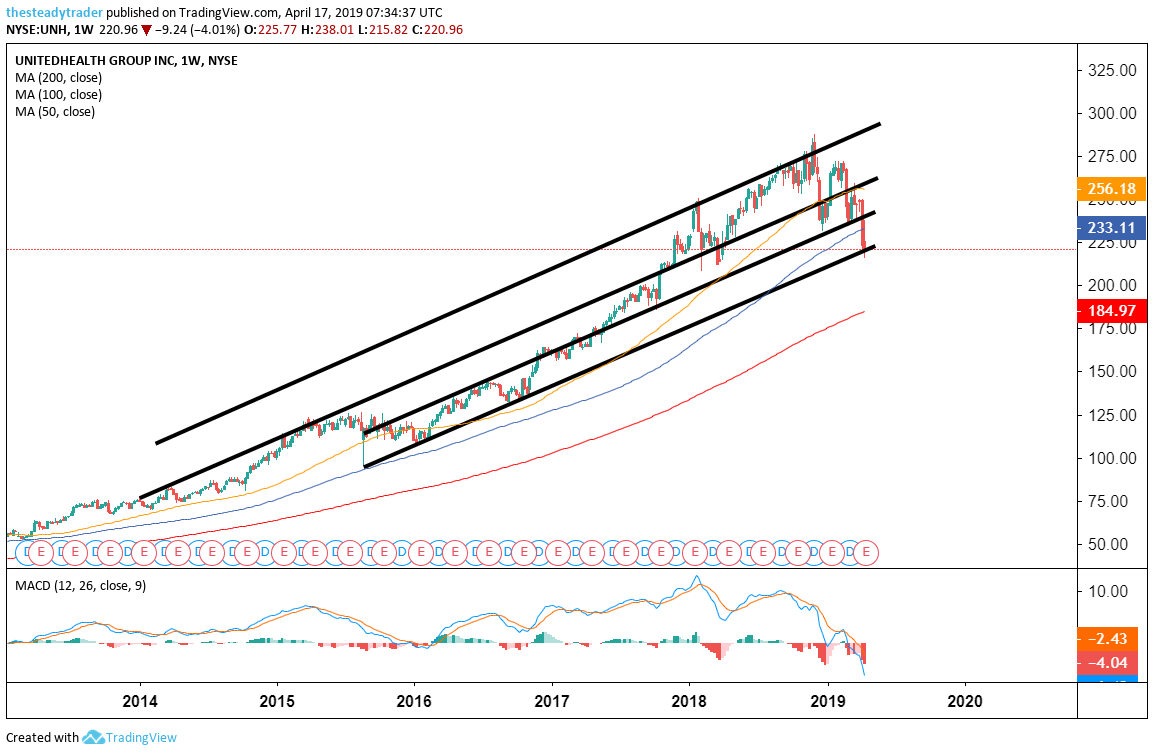
For some perspective let’s note that over the course of the past four months UNH stock has worked its way from the very upper-end of its longer-standing up-trend to the very lower end. While this price action looks ugly from a bull’s perspective, it is also notable that the stock is now at record oversold levels from a momentum perspective, as noted by the weekly MACD indicator at the bottom of the chart.
UNH Stock Charts
Click to Enlarge
Moving averages legend: red – 200 week, blue – 100 week, yellow – 50 week
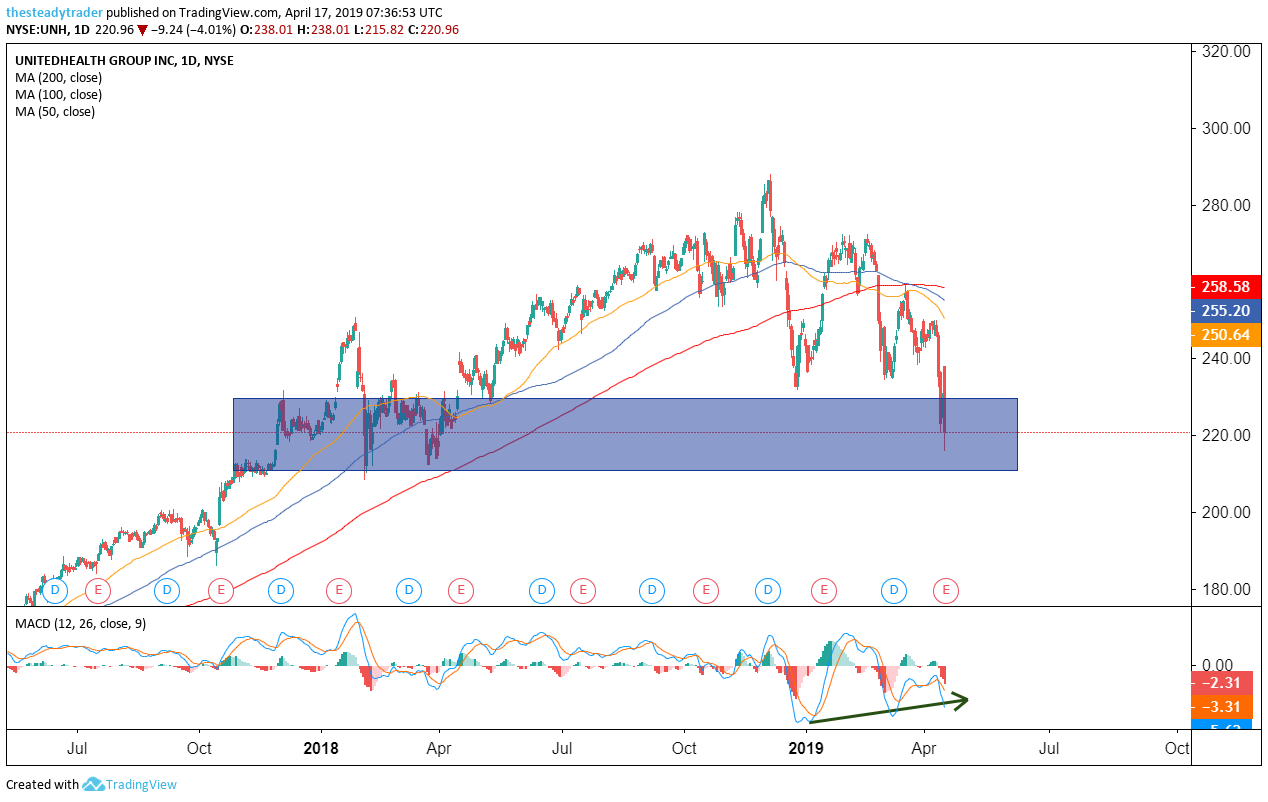
On the daily chart, we see that UNH stock found notable resistance at a confluence of its medium-term moving averages in March. Although the stock fell to fresh YTD lows this week on the back of concerns around “free healthcare for everyone” headlines, from a momentum perspective it has so far failed to make new lows, giving us so-called “positive divergence” from its price.
Click to Enlarge
Moving averages legend: red – 200 day, blue – 100 day, yellow – 50 day
On Tuesday, April 16 UnitedHealth stock gave initial signals of seller exhaustion, but it has yet to complete a real bullish reversal. The daily candlesticks will make an actionable bullish reversal more than clear, particularly if and when the stock gives us its next notable seller exhaustion and green, up day.
Speaking of candlesticks, on Thursday, April 18, I am holding a special webinar to showcase the highest probability candlestick pattern that I know and practice. Click here to register.
Active investors and traders could look to buy some UNH stock here around the $220 – $225 area with the next upside target at $250 and a stop loss at $205.
Attend Serge Berger’s special webinar: The highest probability candlestick pattern, period. Click here to register.