The more the sharp year-to-date rally continues the more I see those ominous parabolic stock charts pop up. The most recent on my screens is MasterCard (NYSE:MA), which thanks to its post-earnings rally on Tuesday, April 30, is now record overbought. Active investors and traders could look to play MA stock on the short side for a trade with defined risk.

Before digging deeper into my trade idea for MasterCard stock, let’s first examine why overbought or oversold stocks tend to offer good so-called “mean-reversion” trading opportunities, but trading and investing with the trend still ultimately offers better opportunities. This will give us a better understanding of the opportunity in MA.
The overbought and oversold stocks I look at for mean-reversion trades in are ones where the stock in question has flipped its chart from steep to vertical, i.e., parabolic, and those opportunities — in my 21 years of trading experience — offer some of the highest chances for profitability.
MA Stock Charts
Click to Enlarge
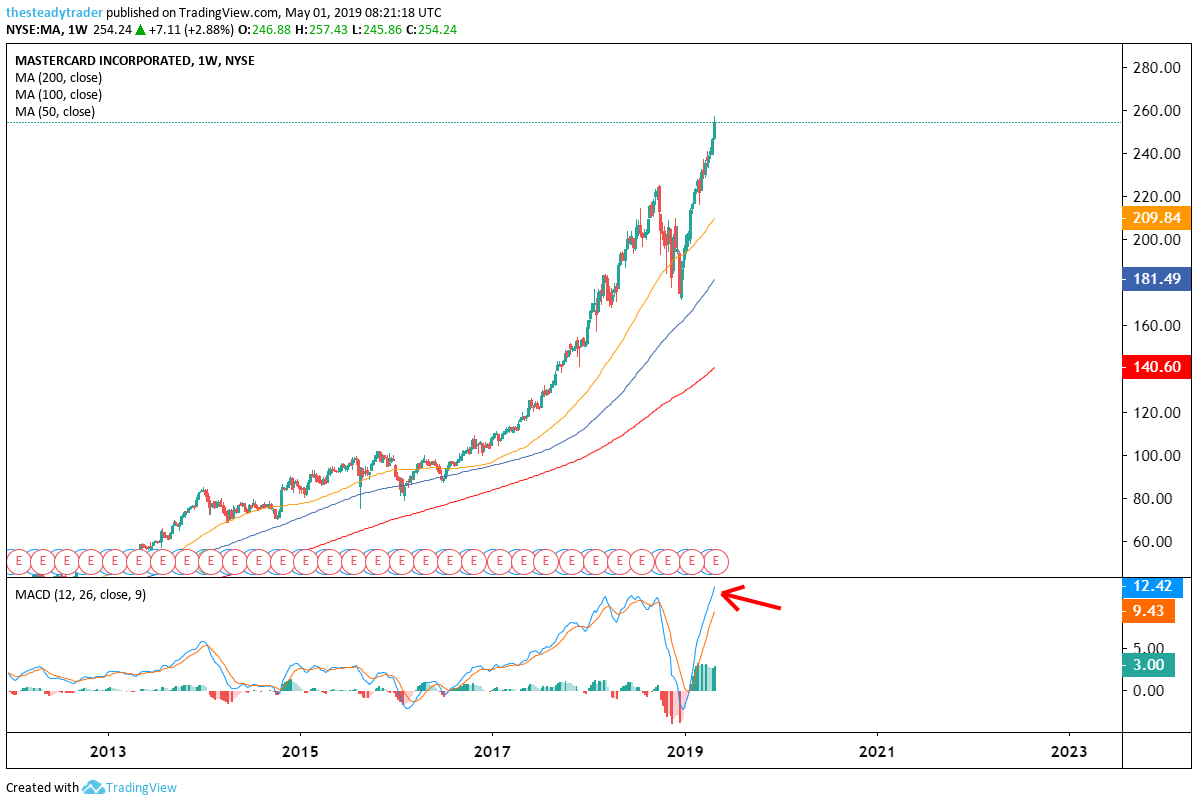
Looking at the multi-year weekly chart of MA stock we see that it has been one heck of a performer over the years. But each time it goes from steep to vertical the stock pauses or mean-reverts lower for a period. Currently, on this longer-term chart, we can see that the stock is once again far removed from its longer-term moving averages while also reaching a fresh all-time overbought reading on the weekly MACD momentum oscillator at the bottom of the chart.
To be clear, even this parabolic move does not mean the stock has to immediately reverse gears lower, but in my long-time experience the acceleration to the upside at this speed is unsustainable and at the very least the upside is limited, i.e., capped for the time being.
Click to Enlarge
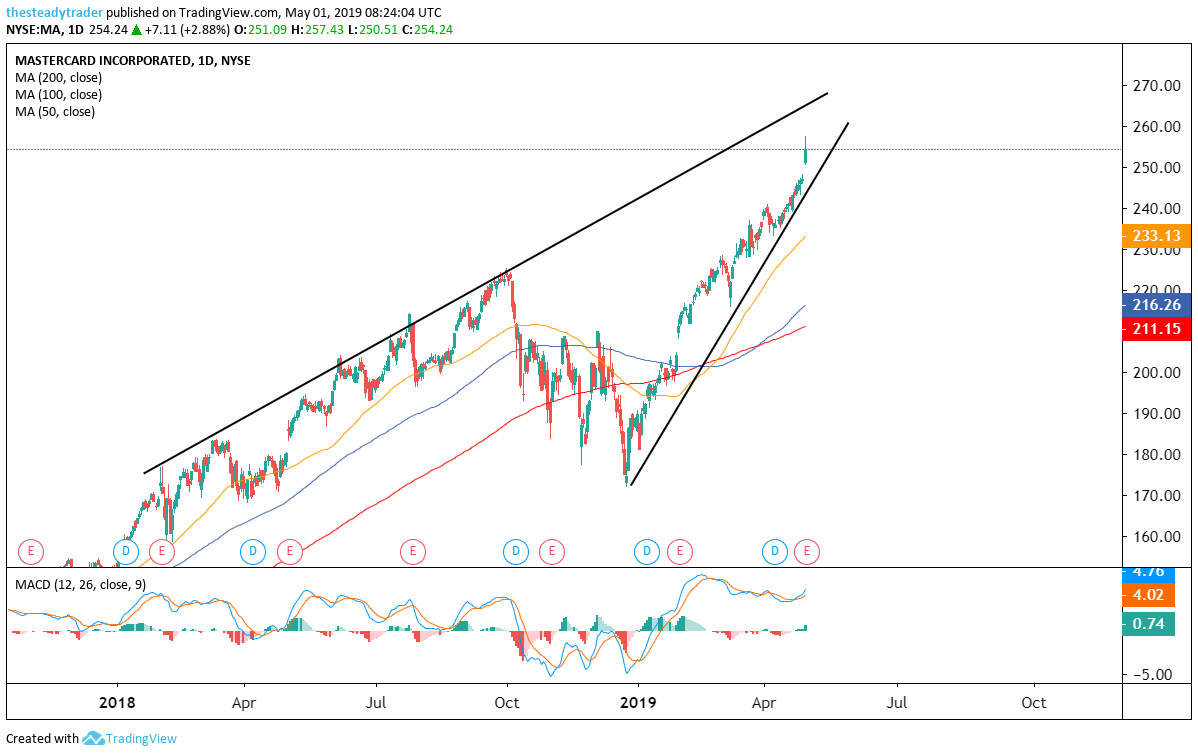
Over the past two weeks, MasterCard stock rallied in an ever tighter range right into the April 30 earnings report. And to top this off, following the earnings report, the stock rallied even more … taking the steep year-to-date rally into parabolic take-off mode.
To look for some reference price levels, I drew a couple of simple yet time-tested lines on the chart. The lower chart defines the 2019 up-trend, while the upper chart defines the 16-month up-trend. After the April 30 rally MA stock is now only a stone’s throw away from the upper resistance line, i.e., a couple of percentage points higher. If we take those two lines together we can see a rising wedge pattern, that historically and ultimately lends itself well to a sharp mean-reversion move lower.
To explain this high probability candlestick pattern in detail, I am hosting a special webinar on May 1 for InvestorPlace readers. Register here.
Active investors and traders at this juncture could look to leg into short positions in MA stock around the $250 – $260 area. The next downside target is $240. Should the stock simply push sideways from here for a few weeks and then flash a bullish reversal higher, a stop loss would trigger on this trade. Alternatively, options traders could look to buy simple at the money puts or put spreads using June or (more conservatively) July options.
Attend Serge Berger’s special webinar: The highest probability candlestick pattern, period. Click here to register.