Editor’s Note: U.S. markets will be closed all day on Thursday, July 4, for Independence Day; therefore, the next Trade of the Day will hit your inbox on Friday, July 5.

Shares of Facebook (NASDAQ:FB) have had a stellar run so far in 2019, up nearly 50% since early January. While FB stock is essentially flat since late April, it continues to trace out bullish patterns when you look at it through the lens of technical analysis. And when you look at it that way, it’s pointing toward higher prices.
Before looking at the charts, allow me to say a word on the potential idiosyncratic risks around FB stock. While nothing new, various regulatory issues are still out there around Facebook as well as other communications companies. Any time a company has government bodies investigating or otherwise looking to tighten regulations, it is a risk that traders or investors must respect. Moreover, these risks can quickly flair up or go away with headlines, leaving one little time to react.
FB Stock Charts
With that said, so far Facebook stock is just about flat performance since early 2018, while still being sharply higher for 2019. To be clear, there have been plenty of oscillations in the stock.
Click to Enlarge
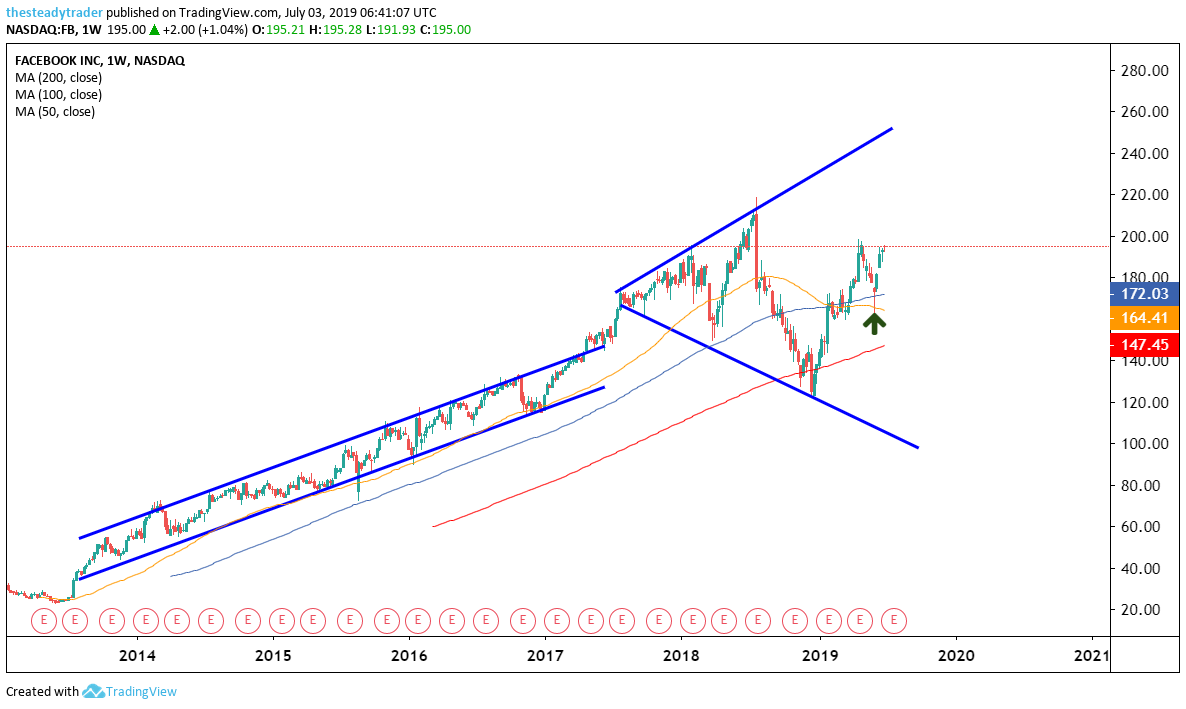
On the multi-year weekly chart we see how orderly an up-trend this stock was trading in from 2014 into spring 2017, as marked by the two blue parallels. In the April and May 2017, the stock began to break to the upside of the long-standing trend, which was the beginning of a big blow-off rally that saw its crescendo more than twelve months later in the summer of 2018.
The blow-off rally, followed by the subsequent selloff in Q4 2018 now allows us to draw a so-called “megaphone pattern” on the charts using the two blue lines. The pattern simply shows the stock’s oscillation between the two lines, since 2017. At present, given the year-to-date momentum one could argue that FB stock will continue to work its way higher within this pattern.
Click to Enlarge
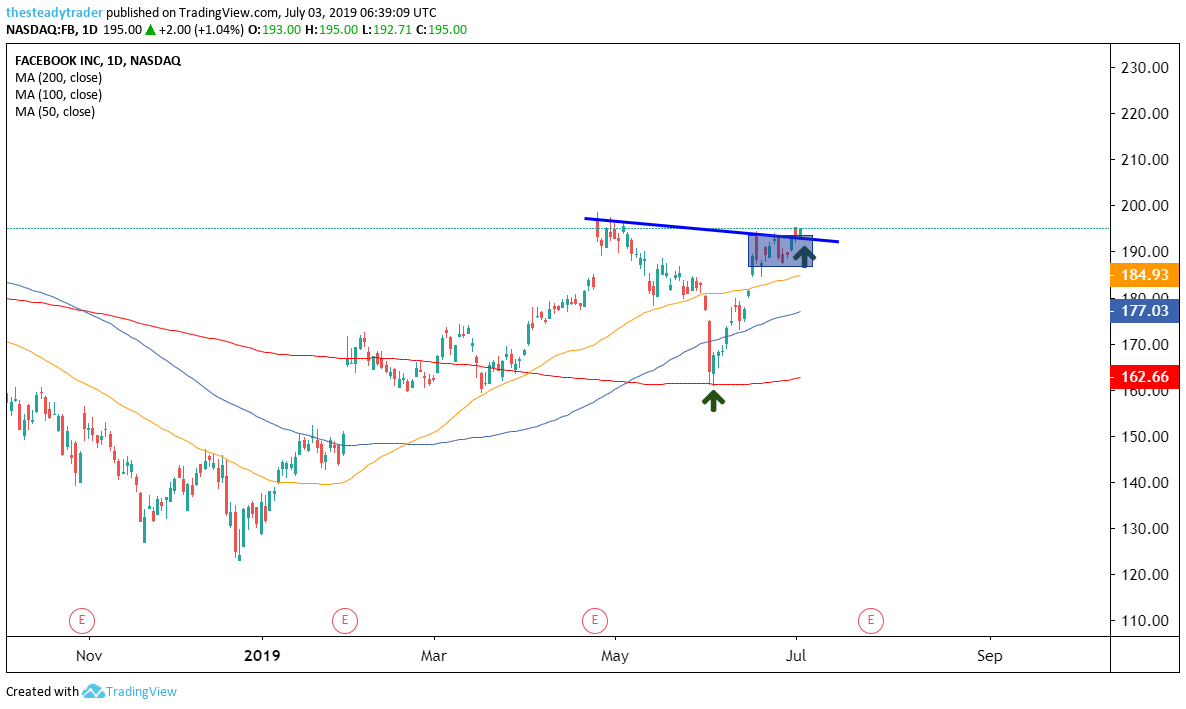
On the daily chart, we can see that in early June, FB stock bounced right off its red 200-day simple moving average. The stock then squeezed higher in subsequent weeks, pushing above its medium-term moving averages. Over the past week and a half, the stock has paused again and trotted sideways in a consolidation pattern, just below its April highs, i.e., below the $200 mark.
From here, barring any major new outside news, FB stock’s path of least resistance seems to point higher for the near-term toward $200, followed by $205 and possibly $210. Any major bearish reversal on a daily closing basis is a stop loss signal.
It is also noteworthy that any broader market bearish reversal would most likely also affect Facebook stock, and thus lead to a stop loss trigger in this trade idea.
Get FREE ACCESS to Serge’s renowned Stock Market Scanner with actionable trade ideas. Get it HERE.