To say that Procter & Gamble (NYSE:PG) stock has had a big rally in 2019 is an understatement. The stock currently resides higher by about 30% and, as a result, its chart has entered parabolic rally mode. While I like PG as a company, PG stock, in the near term, is vastly overbought and active investors and traders could look to the short side for a trade.

Readers of this column know that my analysis always starts using a top-down approach, which for stocks means taking the broader market into context, then focusing on the sector of any given stock and, finally, honing in on single stock opportunities.
PG being a consumer staples stock dictates that we have a look at the consumer staples sector first. This sector of the S&P 500 is higher by about 20% for the year-to-date and up more than 4% over the past 30 days alone. It’s been one heck of a good run for this traditionally more defensively postured part of the stock market, but I think the sector is now near-term overbought.
PG Stock Charts
Click to Enlarge
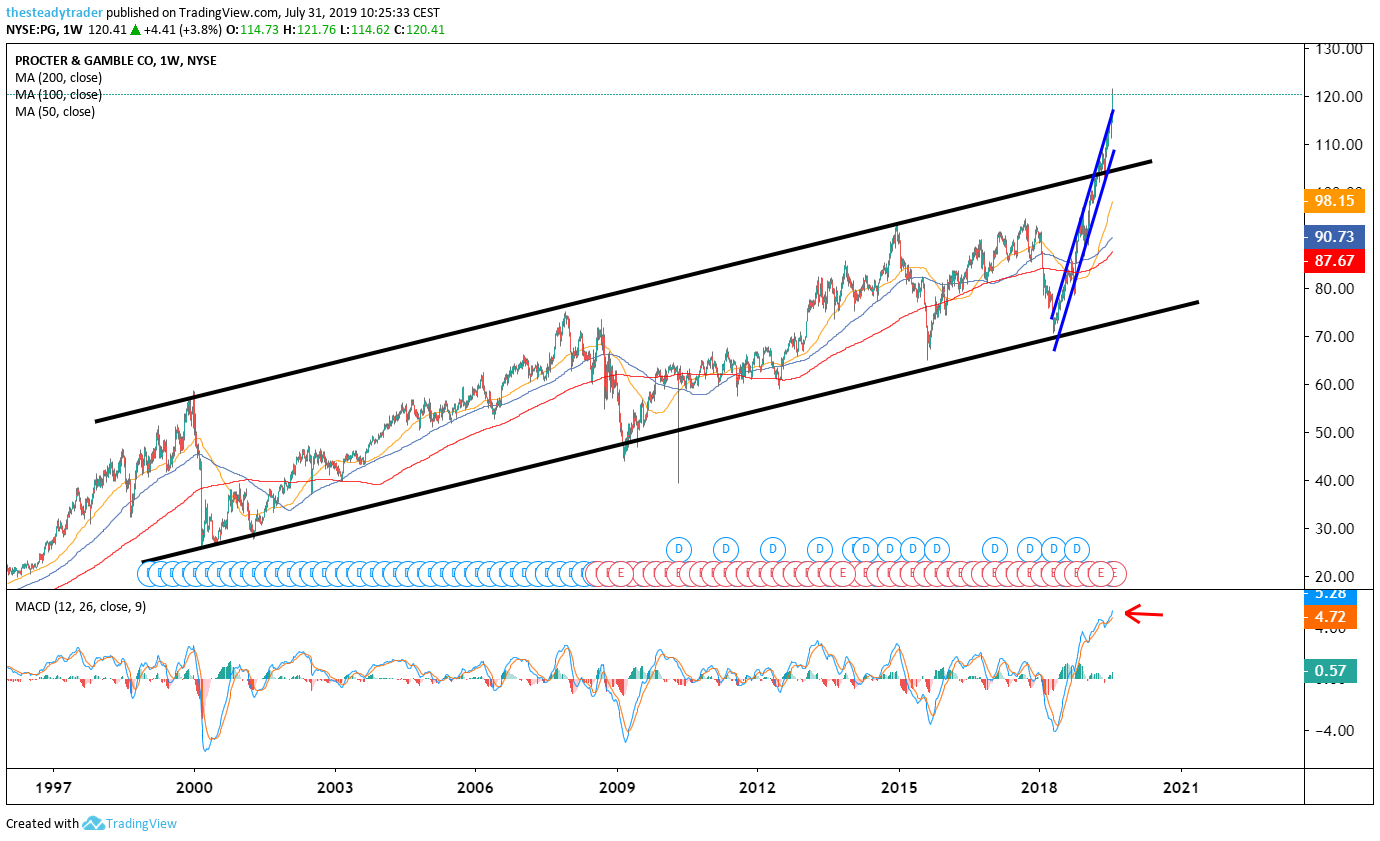
This brings us to PG stock. One of my favorite trading setups is when I see a steep slope/chart go into vertical overshooting mode, i.e., parabolic. On the multi-year weekly chart we see that after a multi-year ascent in an orderly up-trending channel, PG this year went parabolic and in early summer began to break out of the channel marked by the two black parallels. Note also that the MACD momentum oscillator at the bottom of the chart is now record overbought.
None of this has to mean that Procter & Gamble stock will fall into a major bear market from here, but the rate of ascent is most likely not sustainable and a mean-reversion lower is likely.
Click to Enlarge
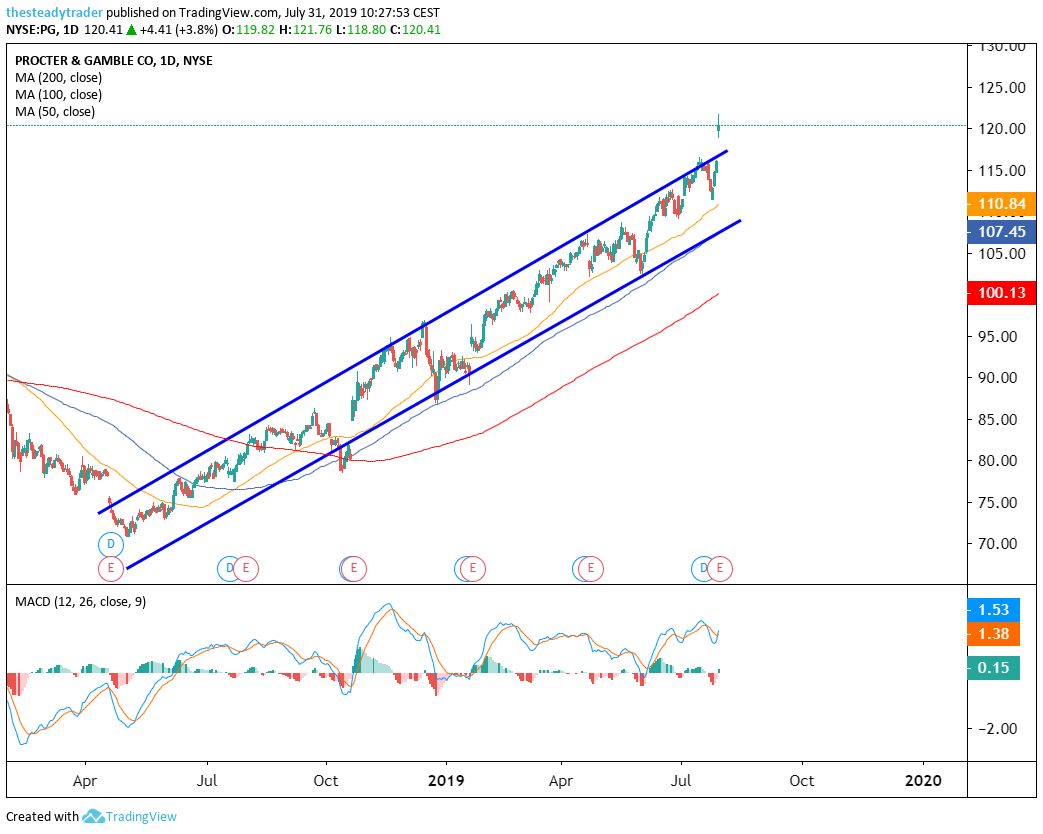
On the daily chart, note that this year, PG stock rose higher in a steeper channel marked by the blue parallels and that on July 30, following the company’s latest earnings report, the stock managed to overshoot this already vertical year-to-date ascent.
By most definitions, this is now a parabolic chart and I like the idea of putting on bearish trades to profit from a mean-reversion move lower in the stock in the coming weeks.
As such, I suggest shorting PG stock around the $120 area using a first profit target at $115. Any strong bullish reversal following a dip in the stock would be a stop loss signal.
Myself and my clients prefer to structure a trade in the highest probability manner, which, in this case, means selling a very specific options spread.
In order to teach this special options trade I am holding a webinar for InvestorPlace readers on Wednesday July 31. Register here.
Click to Enlarge
Join Serge in an exclusive live webinar: The steady income options strategy. Register HERE. As of this writing, he did not hold a position in any of the aforementioned securities.