Shares of financial stocks as represented by the S&P 500 Financials index have largely trotted sideways for 2019, after the initial rally early in the year. Shares of American Express (NYSE:AXP) on Sept. 3 flashed a B2 bearish reversal signal and now look headed toward a technically well-defined next downside target.

As we enter the historically more volatile September-October period, it is particularly important to respect that the stock market is a highly correlated asset class. This is to say that if broader stock market volatility sees another spike, then it will affect most stocks.
Case in point is the financial sector. The current environment of crashing bond yields, inverting yield curves and negative yields in other parts of the world hardly bodes well for banking and other financial stocks. As such, this sector for the time being — and all else being equal — is not one where I personally would want to put on bullish trades.
To gain some perspective on the multi-year picture of AXP stock I created a logarithmic chart. Here we see that while the stock has had an impressive run over the years; it is also now wedged between two defined lines of support and resistance. At the bottom of the chart I added the weekly MACD momentum oscillator, which just a couple of weeks ago was near record overbought.
In my eye, considering the broader interest rate and economic backdrop as well as the chart analysis, this stock is limited on the upside with more risk to the downside.
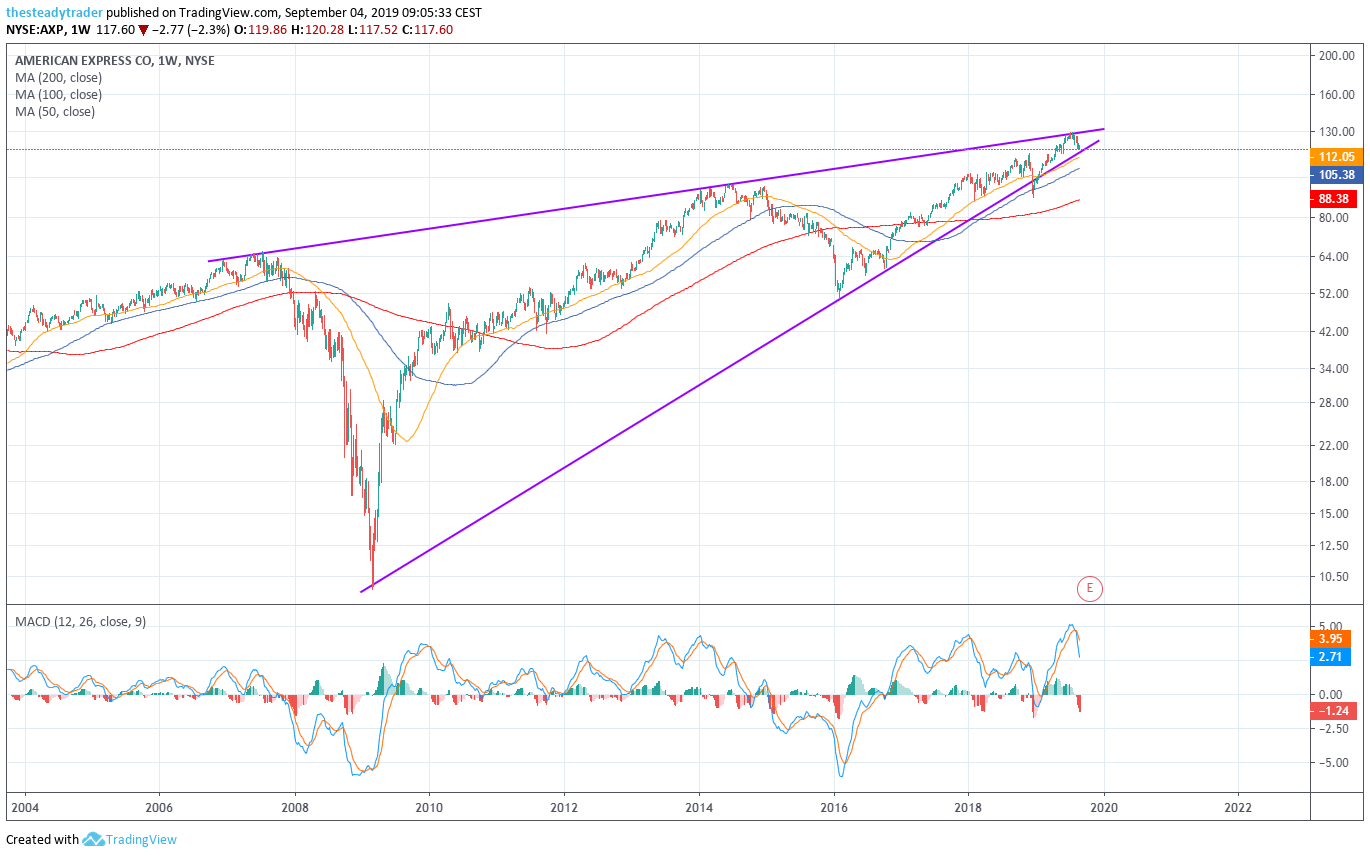
Click to Enlarge
On the daily chart, we see that over the past few weeks AXP stock has systematically broken below one technical support level after another. In early August, the stock first slipped below the purple diagonal support line, then the yellow 50-day moving average and finally below the blue 100-day moving average. While the stock doesn’t have to drop in a straight line from here (in fact, I expect it to be bumpy), the next “logical” downside target by my work suggests to be the red 200-day moving average. This moving average currently resides around the $113 – $114 area.
Active investors and traders could look to short AXP stock toward the 200-day moving average as a next downside target, using the $122 level as a stop loss.
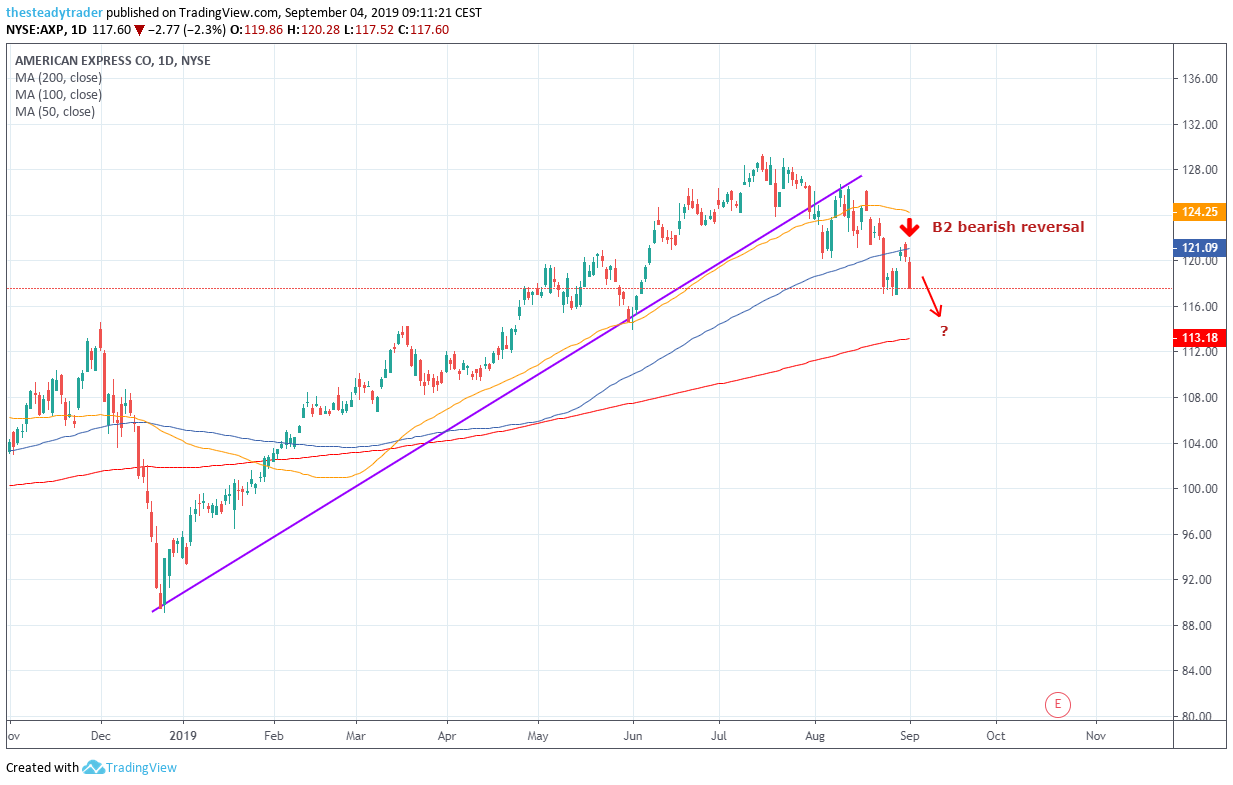
Click to Enlarge
Get FREE ACCESS to Serge’s renowned Stock Market Scanner with actionable trade ideas. Get it HERE.