The more I look at Alibaba (NYSE:BABA), the more I believe it is undervalued.

And when I compare it to Amazon (NASDAQ:AMZN), I think it’s clear BABA stock is headed up
Both companies have had roughly similar growth paths and markets. But Alibaba seems to be so far below the valuation metrics of Amazon there seems little question the market will catapult prices upward eventually.
One of the first differences I see is that Amazon has over twice the market capitalization as Alibaba. Amazon has a market cap of $1.5 trillion, whereas Alibaba has just a $674 billion market cap.
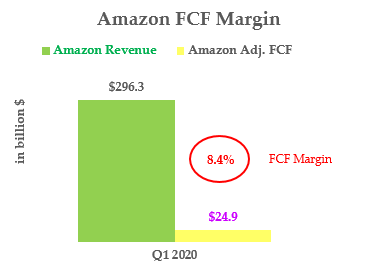
But here’s the thing. They have very similar free cash flow (FCF) profits. For example, in the last 12 months (LTM) to March-end, Amazon produced an adjusted FCF of $24.9 billion. But Alibaba generated $20.9 billion.
Differences In FCF Margins
That right there implies Alibaba stock should be worth considerably more. But the near-equal FCF is even more striking when you compare the amount of revenue the two companies brought in.
Click to Enlarge
For example, as you can see in the chart at right, Amazon generated LTM revenue of $296 billion. It was only able to extract 8.4% of that as FCF.
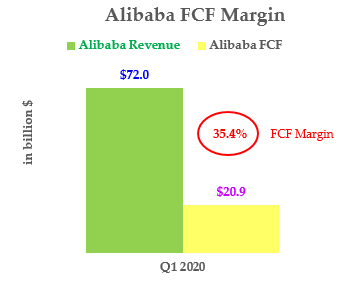
If you look at Alibaba’s financials, you see that their LTM revenue was just $72 billion.
But the company was able to generate huge margins in free cash flow. The $20.9 billion in LTM FCF is an amazing 35.4% of revenue.
This means that Alibaba’s FCF margins (i.e., FCF divided by revenue) for the most recent quarter were over four times larger than Amazon’s.
Click to Enlarge
In other words, for every $100 of revenue generated, Alibaba produced $35.40 in free cash flow. But every $100 of Amazon’s revenue converted into just $8.40 of free cash flow.
So how should Alibaba’s advantage here be represented in the market value of its stock? One way is to look at the FCF yields.
Comparing the FCF Yields
The FCF yield of a stock is the amount of FCF generated in a period divided by its market cap. So, for example, since Amazon generated $24.9 billion in FCF in its LTM to March, compared to its $1.5 trillion market cap, this is 1.39%. It has a 1.39% historical FCF yield.
But Alibaba generated $20.9 billion FCF with just a $673.5 billion market value. So, its FCF is higher at 3.70%. Obviously this is out of kilter. The market value should be much higher.
For example, if Alibaba were to have an FCF yield of 1.39%, the market value would be 2.65 times higher, at $1.787 trillion. That would put the Alibaba stock at a target value of $665.70 per share, up from $250.87 today.
But here is another way to look at the valuation. If Amazon’s $1.5 trillion valuation is the right market cap at 8.4% FCF margins, what is Alibaba’s appropriate market cap? Well, it would be 4.22 times the $673.5 market cap, since Alibaba’s FCF margins are 4.22 times higher than Amazons. That implies Alibaba stock should be $1,057.40.
Therefore, the average of these two market valuations for Alibaba stock is $861.50 per share. That would give it a market value of $2.3 trillion. That’s also 343% higher than today’s stock price.
What To Do With Alibaba Stock
I don’t believe the market will correct this imbalance right away. It could take up to four or five years. Assuming the FCF margin differentials stay the same, here is what the annual results will be.
For example, it could take four years for Alibaba stock to rise to $861.50, or 343% above today’s price. The annualized rate of return each year would be 45.1%. But if it took five years, then the annualized rate of return would be 34.7%.
By the way, here is how you calculate the four-year number: ((1+3.43)^(1/4))-1=0.451.
And for five years, here is the formula: ((1+3.43)^(1/5))-1=0.347.
Those are still very good long-term investment prospects for investors in Alibaba stock.
In fact, even if there is only a 50% probability this will happen, the expected 4-year return is still 22.5% annually, and the 5-year return is 17.3% per annum. These are very high rates of return for most investors. Therefore, I think Alibaba stock looks like a good investment for most patient value investors.
As of this writing, Mark Hake, CFA does not hold a position in any of the aforementioned securities. Mark Hake runs the Total Yield Value Guide which you can review here.