Shares of Starbucks (NASDAQ:SBUX) stock nearly rallied 5% Wednesday morning after the company beat earnings expectations after the bell on Tuesday. They didn’t make money, mind you. In fact, they lost loads. However, investors looked past all the red ink for two reasons.

But, we’ll get into that shortly.
Right now, though, let’s evaluate where Starbucks stock stands after its third-quarter numbers. The company also included strong earnings per share (EPS) guidance for fiscal year 2020.
After that, we’ll analyze how to trade shares of SBUX stock moving forward by taking a closer look at the charts.
So, with all of that in mind, let’s dive in.
Starbucks Earnings Breakdown
For its fiscal third quarter, Starbucks lost 46 cents per share after its same-store sales cratered 40%. However, Wall Street was expecting a loss of 59 cents.
Meanwhile, sales grew to $4.22 billion — topping forecasts of $4.06 billion. And while the numbers were abysmal compared to the year-ago quarter, investors clung to the fact that they weren’t as bad as expected. This is the first reason for the recent gains, and is also a reminder that the quarterly earnings dance is all about expectations.
A second potential reason for the post-earnings rally is Starbucks’ optimistic outlook for its fiscal 2020 numbers. In fact, the company lifted its adjusted EPS forecast to a range of 83 cents to 98 cents.
Sure, skeptics can argue the company is throwing darts in the dark given all the uncertainty that continues to swirl around the novel coronavirus. Regardless, buyers are rushing in after the report.
Starbucks Stock Chart
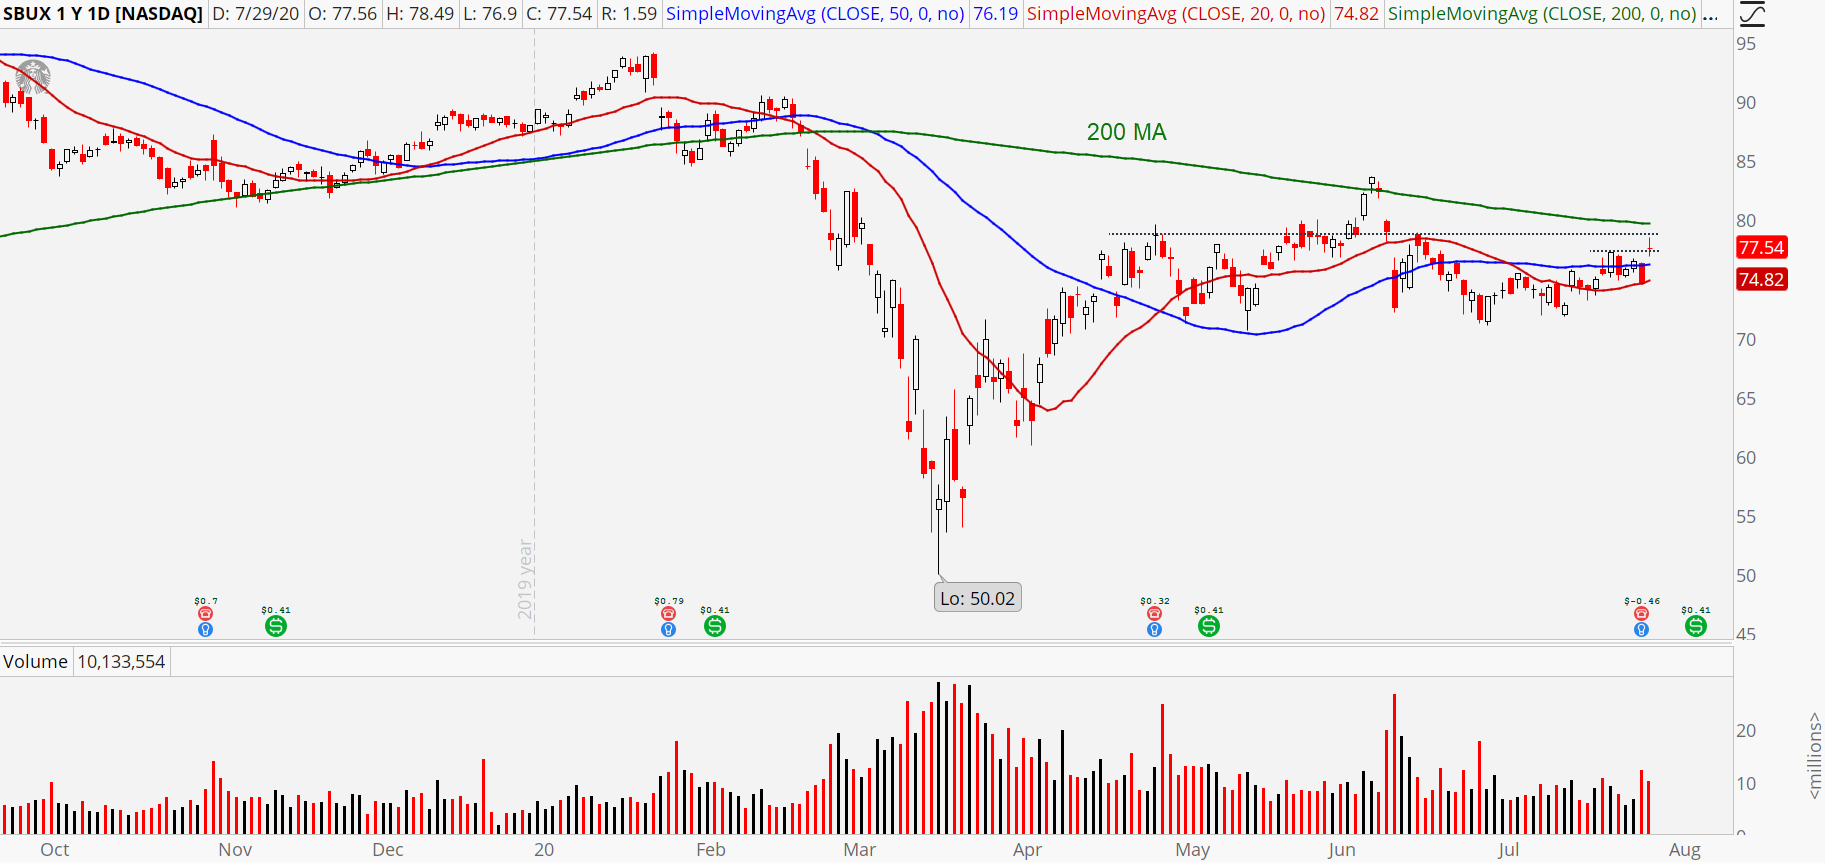
Throughout the morning on Wednesday, Starbucks pared its gains. We’re now sitting with a doji candle, suggesting a more lackluster response than the earlier burst suggested. Time will tell how we close the session, but there are a few trends and price levels that you should keep an eye on.
As far as the trend goes, we’ve completely lost momentum. For over two months, the stock has been treading water. The neutrality is echoed by the 20-day, 50-day and 200-day moving averages, which are all slithering sideways. Active traders hate this type of price action. And if you’re a directional trader, there’s nothing to be done until we get a breakout in one direction or the other.
That said, bulls are hoping today’s earnings-driven pop will be the spark needed to jumpstart a new uptrend finally. And, to be fair, we are pushing above the prior pivot high at $77.30. With the move, Starbucks stock is also back to the north side of its 50-day and 20-day moving average. This was one of the victories needed before an upside breakout became a possibility.
Click to Enlarge
Therefore, while I’m warming to the idea of bullish trades, Wednesday’s jump is far from a clean breakout. In fact, there are two primary problems. First, there remain multiple ceilings overhead, which need to be taken out before the coast is clear. Prior pivots topped out at $79, making it the first resistance to contend with. Then, there’s the 200-day moving average perched at $80. The second problem, which may be fixed by the end of the day, is today’s candle formation.
At the time of this writing, SBUX is up 4% and forming a doji candle. That means we’re still trading near the open, and all of the gains came overnight. The best post-earnings candles see follow-through and strong closes. These are the types of setups I prefer.
I still like the idea of leaning bullish. But if you want more confirmation, you could wait to see if we take out today’s high ($78.49) on Thursday or Friday.
Bull Call Diagonals
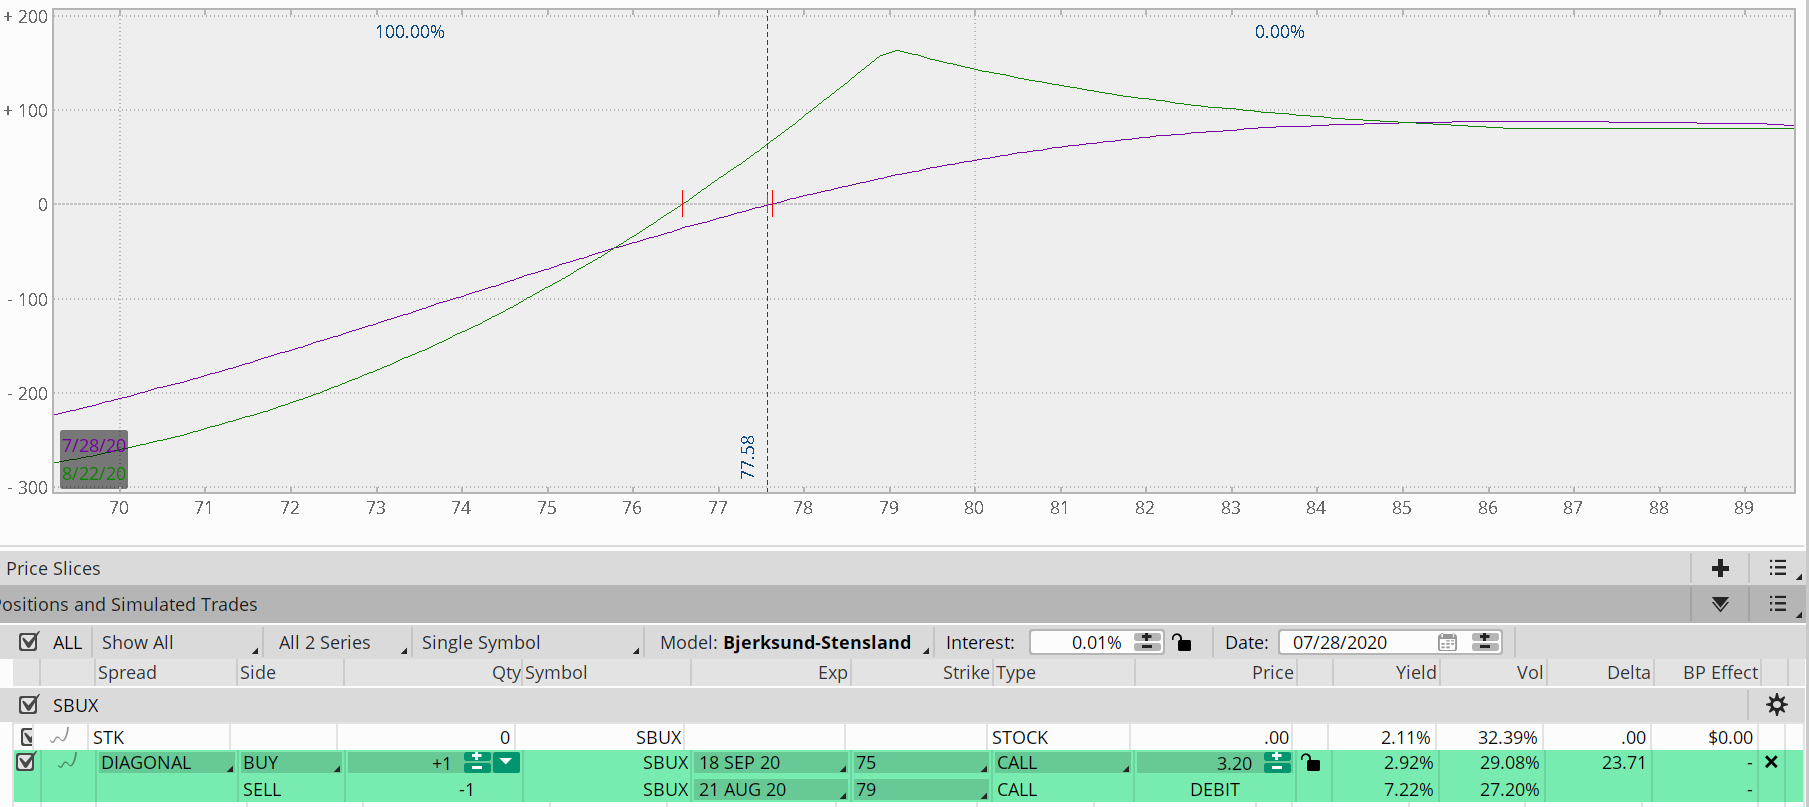
Because of the reservations just mentioned, I suggest a mildly bullish play over an aggressive one. That way, if SBUX stock remains neutral or only pushes slightly higher, we will still profit. And with implied volatility now at the lowly 15th percentile, options are relatively cheap, making bull call diagonals attractive.
We’re going to buy a two-month ITM call and sell a one-month OTM call to position ourselves to profit from neutral to bullish behavior. I’ve included a visual of the risk graph so you can see the profit and loss zones of the position.
Click to Enlarge
The Trade: Buy the Sept. $75 call while selling the Aug. $79 call for a net debit around $3.20.
The max risk is $320, and the target reward is $50 to $100.
For a free trial to the best trading community on the planet and Tyler’s current home, click here! At the time of this writing, Tyler didn’t hold positions in any of the aforementioned securities.