On Aug. 10, Workhorse Group (NASDAQ:WKHS) reported earnings before the market opened. Like most companies with very little revenue though, the report was less about the current quarter and more of an update on its direction. Still, WKHS stock slipped on the day, falling 7.5%.

Is that indicative of where this stock is going now, or was the decline a mistake?
With such a young company, that is a hard question to answer. Let’s put it this way: Workhorse generated an operating loss in excess of $131 million in the prior three months while generating revenue of just $91,900. However, details and context matter.
While the above statement is technically true, it overstates the current conditions. That operating loss was mainly due to several non-cash adjustments related to mark-to-market fluctuations. Ultimately, “A better indication of operating performance would be loss from operations which was $7.0 million this quarter.”
Let’s turn to the charts before taking a closer look at Workhorse.
Trading WKHS Stock
Click to Enlarge
When digging through the press release, there are actually a lot of positives. But the market isn’t taking it that way. Even though the S&P 500 and Nasdaq Composite continue to push higher, the initial move in WKHS stock was lower.
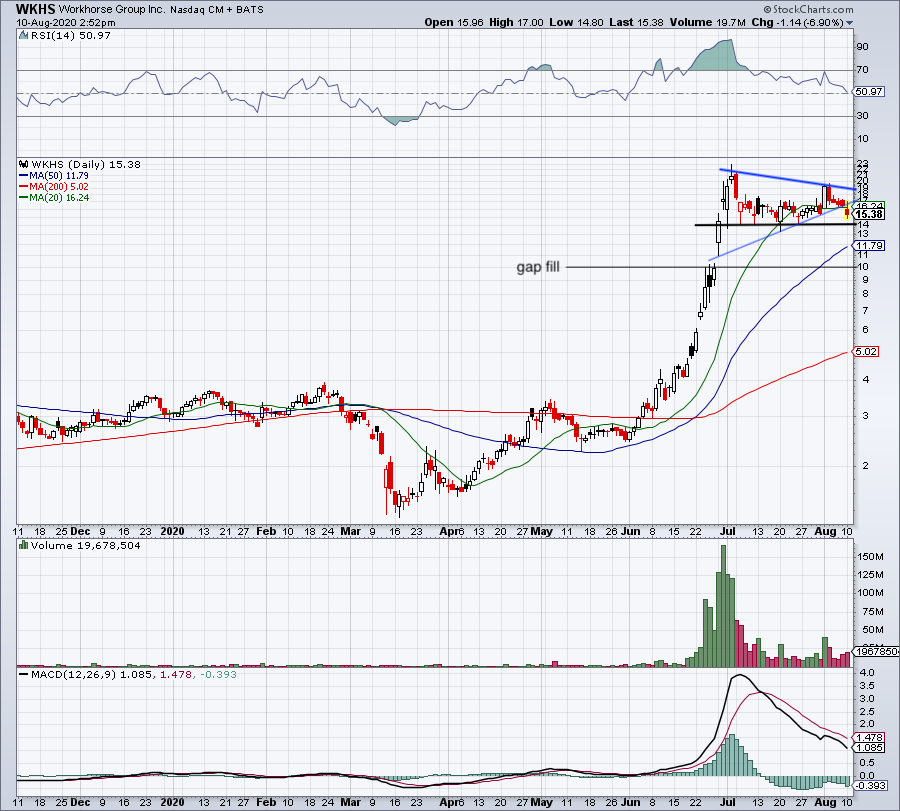
Shares were wedging into a tightening trading range, with uptrend support and downtrend resistance squeezing the stock price. In the month of August, Workhorse was respecting the 20-day moving average as support.
That changed on earnings.
WKHS stock not only broke below the 20-day moving average, but it was rejected by it when shares tried to rally higher. Further, uptrend support was broken as well. The setup isn’t a complete breakdown, but it’s certainly not the reaction that bulls were hoping for.
From here, I want to see if $14 range support will hold. If it does, investors will want to see Workhorse reclaim the 20-day moving average, then potentially retest downtrend resistance. Above that puts the July high in play near $20.
If $14 fails as support, look to the 50-day moving average and the gap fill near $10 as possible downside targets.
WKHS stock has long-term potential, but in order to efficiently trade it, we need to know more than just the news. Instead, bulls need to lean on the technicals in order to improve their risk/reward ratio. For all we know, this stock could be heading for $6. So let’s keep the chart up and, even if it means we miss the bottom, let’s let the technicals guide us here.
Workhorse Has Potential
The downside to Workhorse is that it doesn’t have much business at the moment. If the stock market goes through a rough stretch, then WKHS stock is unlikely to be spared. On the upside though, it does have potential and it is making the right moves.
For those who don’t know, Workhorse makes all-electric delivery vehicles and drones. This quarter, the company made its first delivery of its vehicles to Ryder (NYSE:R), delivering three of its C-series vans.
I know, I know — just three vans. It’s a slow start, but the company is making solid progress. It’s not Tesla (NASDAQ:TSLA) or Nio (NYSE:NIO), but a company doesn’t go from producing zero vehicles to thousands overnight.
In the quarter, Workhorse “Became the first and only medium duty battery electric vehicle (BEV) OEM to receive approvals from both the Environmental Protection Agency (EPA) as well as the California Air Resources Board (CARB), permitting the Company to sell vehicles in all 50 states.”
Further, the company “Reaffirmed previous production and delivery target of 300-400 vehicles in 2020.”
So the operational numbers weren’t as bad as the headline numbers indicate, while management reiterated guidance and began delivering vehicles last quarter. I like the potential here. But we must remember this is a speculative holding with a market capitalization of just $1.6 billion. It has few fundamentals and needs the technicals to shape up to determine if it’s worth a second look.
Bret Kenwell is the manager and author of Future Blue Chips and is on Twitter @BretKenwell. As of this writing, Bret Kenwell did not hold a position in any of the aforementioned securities.