Ever since earnings torpedoed Fastly (NYSE:FSLY), its share price has been floundering. Now, a battle has commenced at a critical price threshold that will determine the fate of FSLY stock over the coming weeks. Therefore, let’s breaking down the price levels that matter and how bulls and bears should trade moving forward.

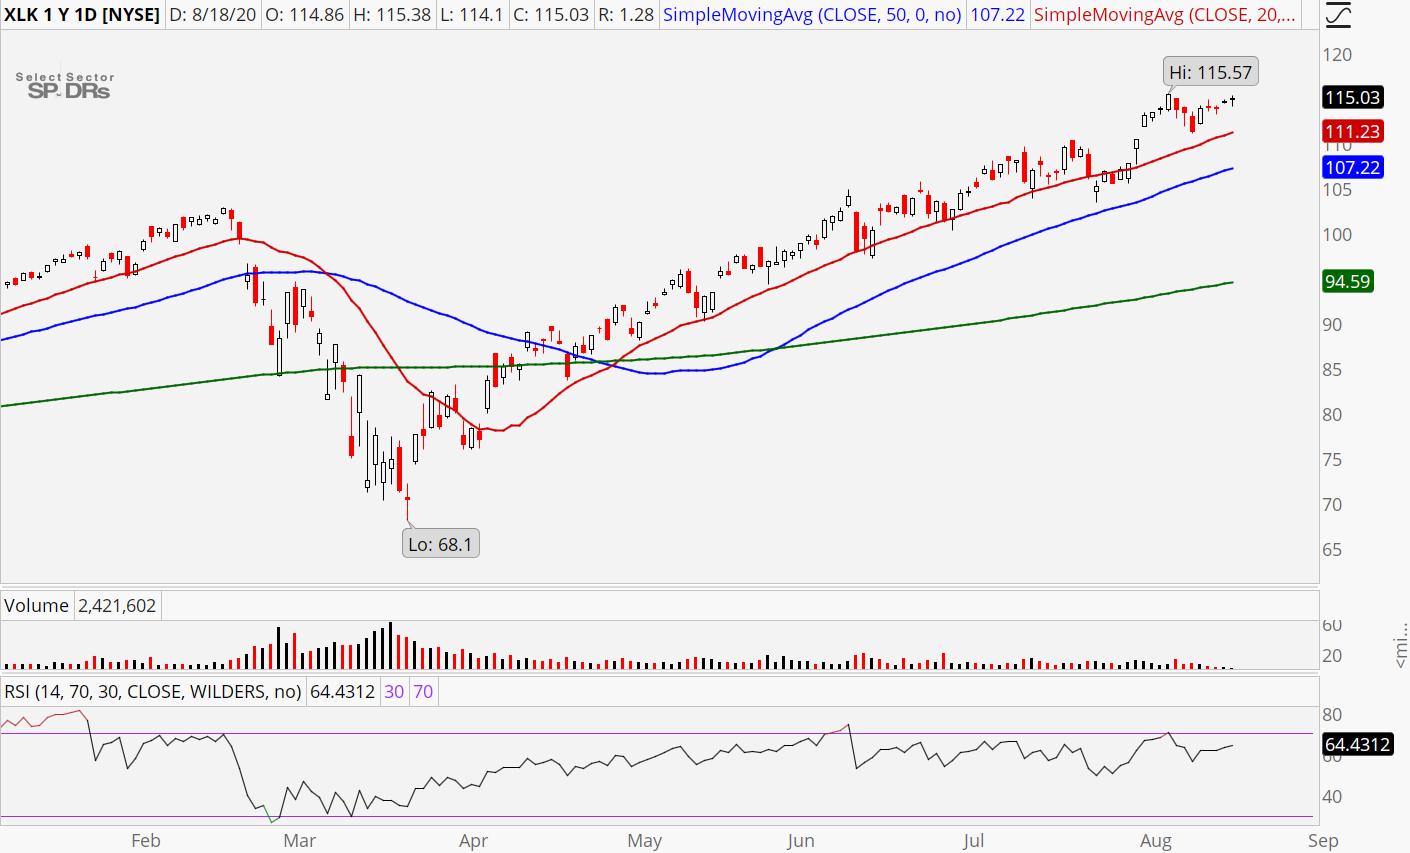
Before diving into the issues hounding Fastly’s chart, it’s worth looking at the broader tech sector to determine if the weakness is a sector-wide problem. That said, I’ve included a graph of the Technology SPDR (NYSEARCA:XLK) below.
The trend looks fantastic. XLK stock has led the charge higher from the March low with an endless stream of higher pivot highs and lows. Just last week, we saw another higher low develop to remind spectators that dip buyers remain alive and well.
Click to Enlarge
In turn, all major moving averages are pointing higher and echo the price strength. In fact, the rising 20-day moving average has proven particularly powerful by providing support over a half a dozen times since March.
With this impressive show of muscle-flexing in the background, it’s evident that whatever is ailing Fastly shares is idiosyncratic. And that’s a fact that’s tough to spin bullish. Relative weakness has been and always will be a reason to either abandon long-ideas or pursue short ones.
My preferred angle of attack here is to prep a bearish trade to play off the looming breakdown. But, I will identify the price level — which, if breached, would pull me back to the bull camp.
FSLY Stock Charts
Click to Enlarge
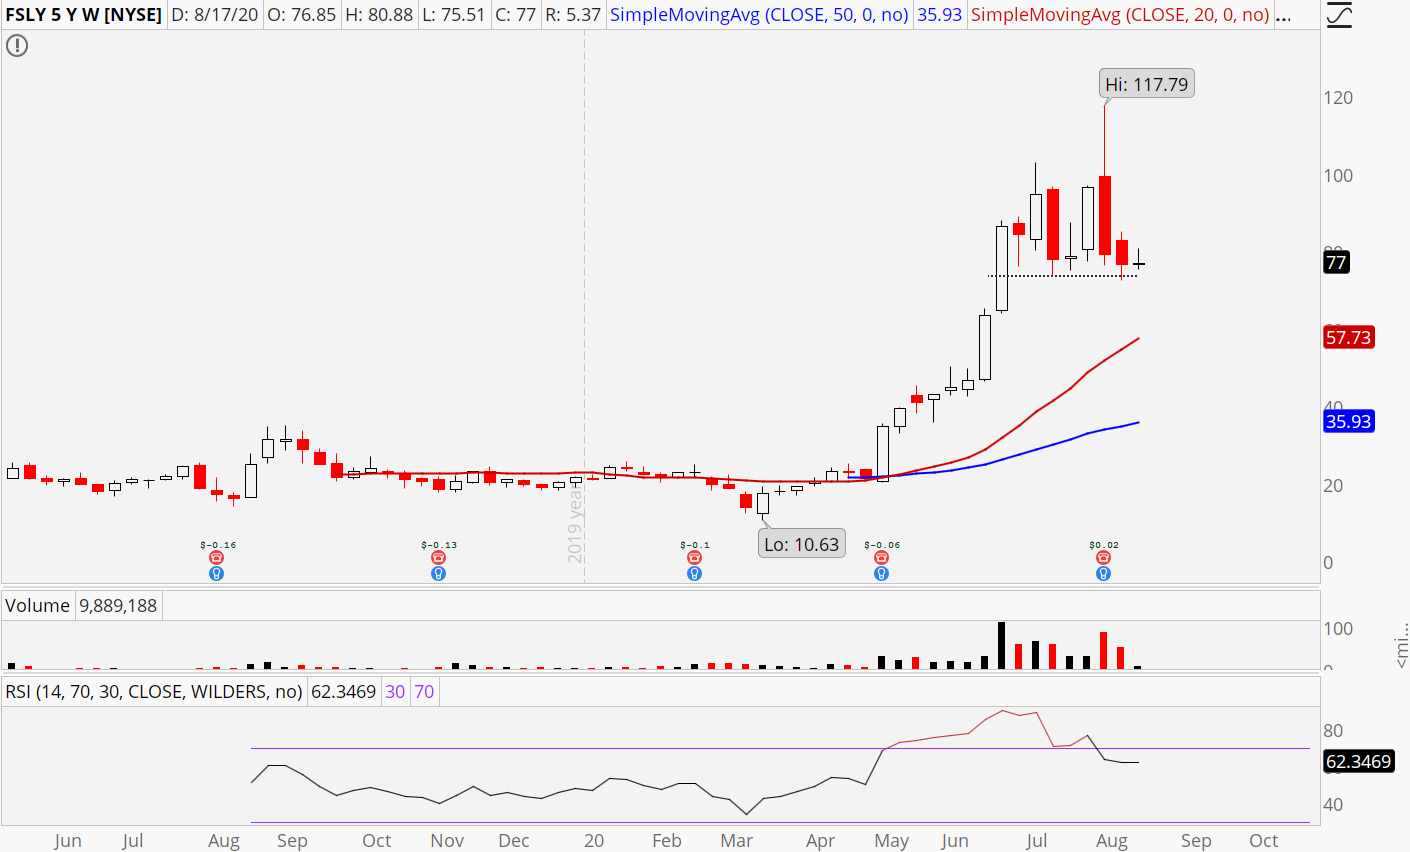
The best way to quickly grasp Fastly’s history as a public company is with a weekly chart. Its first year of life was a relatively dull sideways slog. But in March, everything changed.
After snapping the range to the downside amid an epic fakeout, prices shot to the moon — rising ten-fold from $17 to $120 in less than six months. Although, as is often the case with such a rapid rise, perception outpaced reality; Which left FSLY stock vulnerable to a downside shock if earnings weren’t perfect.
And, well, they weren’t perfect. Two weeks and a 35% haircut later, FSLY stock finds itself fighting to stay above the 50-day moving average and a critical horizontal support zone at $75. You can see how important the floor is on the weekly chart above. If we crack $75, there aren’t any other old pivots until down at $50, which leaves quite the price void. Therefore, let’s just say traders better watch out below if bulls prove unable to defend this support area.
However, one silver lining on the weekly time frame is the RSI still sits well into bullish territory at 62. The retracement hasn’t been deep enough to kill the longer-term uptrend. Not yet, at least.
Moreover, you can see Fastly’s current wrestle with the 50-day moving average and the $75 zone more clearly on the daily time frame. The past week of chop is taking on the form of a low base pattern, which would be completed and confirmed if the floor gives way. And while the RSI remains bullish on the weekly, it has turned bearish on the daily by falling to 45. In fact, it’s the lowest reading for the momentum indicator since March.

Click to Enlarge
Overall, would-be buyers need to wait until FSLY stock rallies back above $88. That will place the stock on the high side of the 20-day moving average and signal the uptrend is reasserting itself.
Play the Breakdown With Bear Puts
If you’re willing to bet we see another down-leg, then bear put spreads are a smart way to go. They’re far cheaper than buying puts, and hedge off some of the volatility risk.
The Trade: Buy the Sept. $75/$65 put spread for around $3.85.
If you want more confirmation, you could wait for a break of $75 before pulling the trigger. The max loss is the initial cost, and the max gain is $6.15.
For a free trial to the best trading community on the planet and Tyler’s current home, click here! At the time of this writing, Tyler didn’t hold positions in any of the aforementioned securities.