Are stocks less attractive now that yields are rising? … how to answer that question for yourself … the bottom line from our technical experts
Before we jump into today’s Digest a quick note…
The stock market is closed on Monday in honor of Presidents’ Day. Given this, our Customer Service Department will be closed as well.
If you need help, they will be happy to assist you on Tuesday when offices reopen.
***Today’s Digest will help make you a wiser investor
That’s a bold statement, but I stand by it.
In this week’s Strategic Trader update, our technical experts, John Jagerson and Wade Hansen, tackle a question that’s weighing on investors…
Can stocks compete with rising yields?
Today, we’ll find out John and Wade’s answer. But the part that will make you a wiser investor is following their methodology in arriving at the answer.
John and Wade utilize an effective yet simple, step-by-step analysis that you’ll be able to use for the rest of your investing career. It provides a quick, logical, quantitatively-based snapshot of the stock market’s relative value.
So, today, let’s do our best to help you make money and become a wiser investor.
Let’s jump in.
***The simple framework to help us price the market
For newer Digest readers, Strategic Trader is InvestorPlace’s premier trading service. It combines options, insightful technical and fundamental analysis, and market history to trade the markets, whether they’re up, down, or sideways.
Returning to today’s focus, here’s John and Wade to set the stage:
Rising yields have been a concern for traders since the beginning of 2022 as Wall Street has wondered how quickly the Federal Reserve is going to raise interest rates to combat rising inflation.
This has caused traders to reduce their risk exposure to stocks, sending the S&P 500 lower, where it continues to consolidate…
Now traders are wondering if the S&P 500 can remain in this volatile consolidation range; what if Treasury yields keep climbing?
To answer this, we need to better understand how Wall Street traders think.
Stocks aren’t the only game in town. There are bonds, real estate, cryptos, private equity deals, foreign assets, commodities, you name it…
At the end of the day, what’s important is the highest risk-adjusted return, or yield. So, how do traders assess their options from this perspective?
Back to John and Wade:
The baseline yields traders typically use when assessing their investment opportunities are Treasury yields – like the 10-year Treasury Yield (TNX) – because they know that Treasuries provide a reliable yield, backed by the full faith and credit of the United States government.
Treasury yields fluctuate as inflation, monetary policy, and economic growth expectations change.
Currently, the TNX is offering a multi-year high yield of 2.04%.
John and Wade suggest rounding to 2.1% to make it easy. So, 2.1% is our starting point. From here, investors can evaluate other investment yields.
***Since the question is about where stocks are going, let’s begin by evaluating the stock market yield
How do we do this?
Back to John and Wade:
You look at the earnings yield – which is the earnings the market generates, compared to the price you are paying for those stocks (i.e. the E/P ratio).
If you’ve never heard of the E/P ratio before, you’re not alone. But even if you haven’t, it should look at least vaguely familiar. That’s because it’s the inverse of the P/E ratio.
So, to find the S&P’s earnings yield, we start with its P/E ratio and then flip it.
John and Wade suggest going to a site like multpl.com to get the P/E. At the time of John and Wade’s update, the S&P’s P/E was 25.32.
Back to the Strategic Trader update:
Now that you know the P/E ratio, all you do is find the inverse of this number to determine the earnings yield on the S&P 500, which in this case is 3.95% (1 / 25.32 = 0.03949).
So, we have our baseline treasury yield of 2.1%. And we have the S&P’s earnings yield of 3.95%. But we’re not ready to compare them quite yet.
***Don’t forget to factor in dividends
Dividends play a huge role in the overall profitability of the stock market.
For some color on this, check out the chart below. Dating back to the 1930s and extending through the 2000s, it shows stock market returns by decade.
The first number is the return from dividends. The second number is the return from price changes.
As you can see, dividends are an enormous component of overall returns.

So, what’s the dividend yield for the S&P 500 today?
Using multpl.com again as our resource, we find that it’s 1.36%.
Now, we combine the earnings yield (3.95%) and the dividend yield (1.36%) to get a total yield of 5.31%.
So, what does this mean? Is it good or bad?
There’s one final step we have to take before we reach our conclusion.
***Factoring in the historical risk premium
Back to John and Wade:
Traders try not to be foolhardy with these investments. They demand a premium for the increased risk they are taking by putting their money into stocks instead of bonds.
This “risk premium” is calculated by finding the total yield (earnings + dividends) a trader can earn from the S&P 500 and subtracting the 10-year Treasury yield.
The risk premium can vary quite a bit depending on market conditions, but the average during the past 20 years has been 3.56% (see Fig. 6).
Figure 6 – Risk Premium Since February 2000
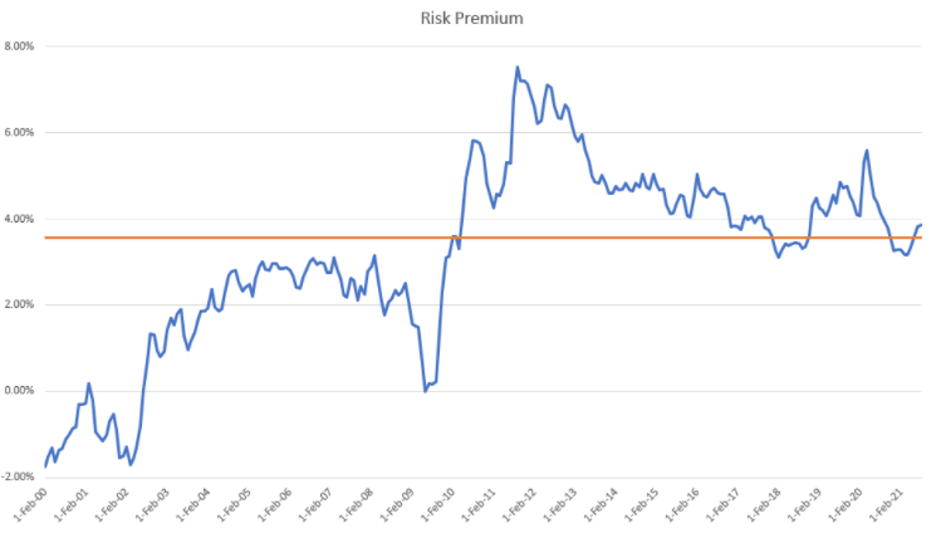
John and Wade point out how the risk premium wasn’t as large during the bull market recovery between 2003 and 2008 (the left half of the chart above, when the blue line is staying beneath the orange “average” line).
This is mostly due to the Fed allowing interest rates to rise during this period. This allowed the TNX to remain higher, which reduced the risk premium.
But after stocks recovered in the wake of the global financial crisis, the risk premium jumped (the right half of the chart above, when the blue line is mostly above the orange “average” line).
This is because the Fed kept interest rates near zero, even though stocks were climbing.
John and Wade note that the risk premium looks to be normalizing today. This reflects how traders are preparing for the Fed to start raising interest rates again.
***Putting it all together, what does it mean for the S&P?
Now that we have all the pieces to the puzzle, let’s find out what it’s telling us.
Here’s John and Wade:
If a trader can earn 2.1% on her money by buying virtually risk-free 10-year Treasuries today and were to demand the average risk premium of 3.56% to invest in stocks, then those stocks would have to yield at least 5.66% (2.1% + 3.56% = 5.66%) to remain attractive.
When you compare the 5.31% return a trader could currently get from the S&P 500 with the 5.66% return an investor would demand if she could earn 2.1% on her money by buying virtually risk-free Treasuries and demanded a risk premium of 3.56% to invest in stocks, you can see the numbers are slightly below average but are pretty close to where you would expect them to be.
So, what does all this mean for the S&P 500, its consolidation range, and the direction stocks are likely to move?
Here’s John and Wade’s bottom-line, which will take us out today:
So long as earnings numbers remain strong and economic numbers – like (Wednesday’s) surprisingly positive Retail Sales number of 3.8% growth – remain bullish, the S&P 500 should be able to hold above support at 4300.
Of course, if Russia invades Ukraine, Wall Street may react by reducing risk, but we’ll have to wait and see what happens.
Have a good evening,
Jeff Remsburg