Monday morning was an interesting moment in the stock market. After trying to rotate over the prior week’s high early on Thursday morning, the S&P 500 rolled over…hard. Everything in its path, including Advanced Micro Devices (NASDAQ:AMD) was under pressure. Friday was even worse for the markets, although AMD stock fell less than 2% on the day.
Semiconductor stocks were leaders during the March rally, but were also the “canary in the coal mine” on the recent decline. The group has struggled mightily, with both Nvidia (NASDAQ:NVDA) and AMD stock down significantly. These stocks are 44% and 46% off their Q4 and all-time highs, respectively.
For bulls, it’s a huge blow to sentiment, even though both companies continue to execute rather well. Just last quarter, AMD delivered a top- and bottom-line beat and provided significantly better-than-expected full-year revenue guidance
.
Despite this, the bulls haven’t been able to keep these stocks out of the crossfire from the broader market. At the root of the concern is a fall in demand (due to economic contraction), a decrease or cancellation in orders and supply chain issues out of Asia and Eastern Europe.
Click to Enlarge
With AMD stock down so significantly despite a solid fundamental backdrop, I wanted to look at the charts. There’s also something I want to point out about relative strength.
While AMD and Nvidia are not displaying relative strength vs. the Nasdaq or the S&P 500, they were displaying it against other growth stocks just a few months ago. Most growth stocks peaked in the first quarter of 2021. However, there was a handful of stocks in this group that were not only holding up, but hitting new all-time highs as recently as November.
They have almost all rolled over since, but these prior leaders could very well be our leaders once the markets return to an upward trend.
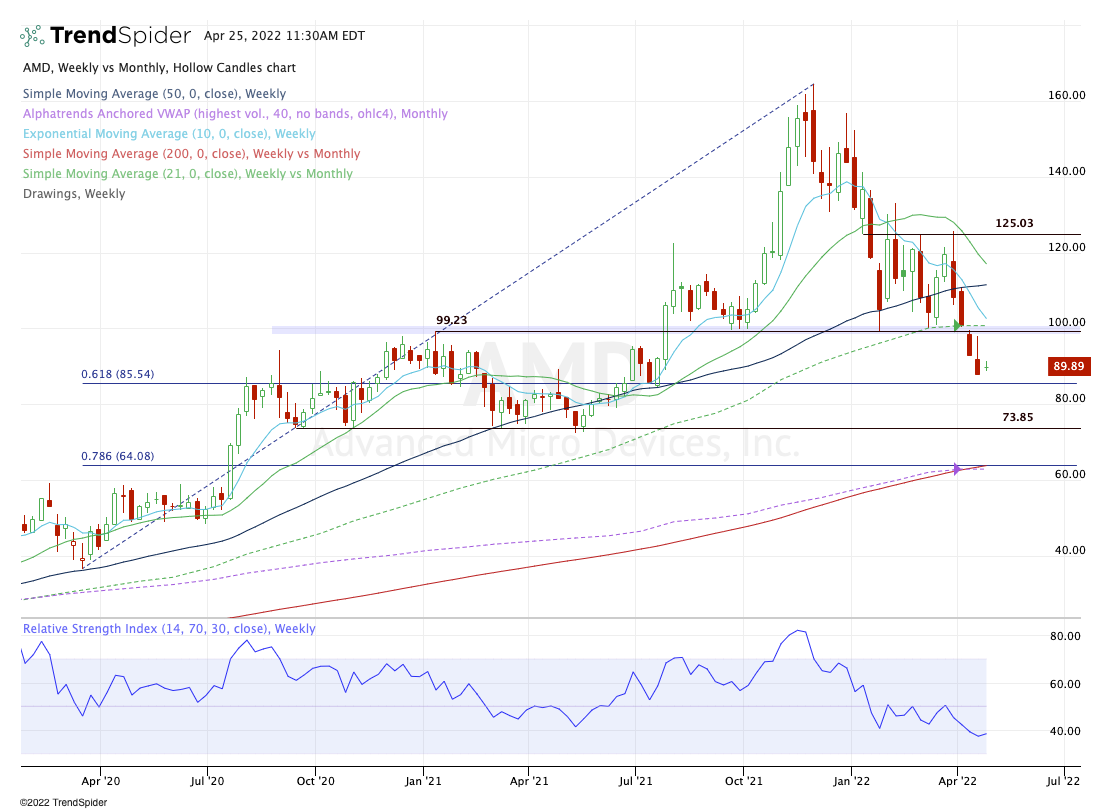
Looking to the chart, it’s no surprise that AMD stock failed to hold the key $100 level. After all, a level can only be tested so many times before it finally gives away. Further, each rally off this level became smaller and smaller.
Now on the downside I am looking at the $85 to $86 area as the first area of support. As measured from the all-time high to the March 2020 Covid low, this area is where we find the 61.8% retracement. Below that and prior range support is in play at between $73 and $75.
If AMD stock blows through both of these zones, then the 200-week moving average and monthly VWAP measure are on deck. Currently, those marks come into play near $64, which is also the 78.6% retracement.
On the upside, AMD needs to reclaim $100 and the declining 10-week moving average to gain any meaningful upside momentum.
On the date of publication, Bret Kenwell held a long position in Nvidia. The opinions expressed in this article are those of the writer, subject to the InvestorPlace.com Publishing Guidelines.