
Tesla (NASDAQ:TSLA) is no stranger to dominating the headlines, and that’s especially true for its polarizing CEO Elon Musk. However, the next two days are sure to garner more attention. This morning, TSLA stock is in the news as its Shanghai Gigafactory reportedly reopens for production. Additionally, the company is set to announce earnings on Wednesday.
While the factory is restarting production, it will certainly look a bit different than before. The Shanghai Gigafactory will be operating in a “closed-loop system,” meaning employees will essentially be living onsite.
Tesla will give employees sleeping bags, mattresses and provide three meals a day. Staff will also have to take a daily Covid-19 test for the first three days along with temperature checks twice a day. As of now, the company has enough inventory for roughly two weeks of operation while utilizing this schedule.
Tesla’s Shanghai Gigafactory is the company’s most productive plant
and has been shuttered since the end of March due to lockdowns. The reopening of the plant comes at a pivotal time, with the company reporting earnings on Wednesday. Investors will be looking to see if the company is still on track for its 2022 delivery target of 1.4 million vehicles.
Tesla’s recent shutdown of the Shanghai factory paired with the opening of its Texas and Germany plants will certainly put pressure on its top and bottom line. The lack of deliveries in Shanghai will weigh on current-quarter revenue, while the opening of new factories will create a short-term dent in earnings.
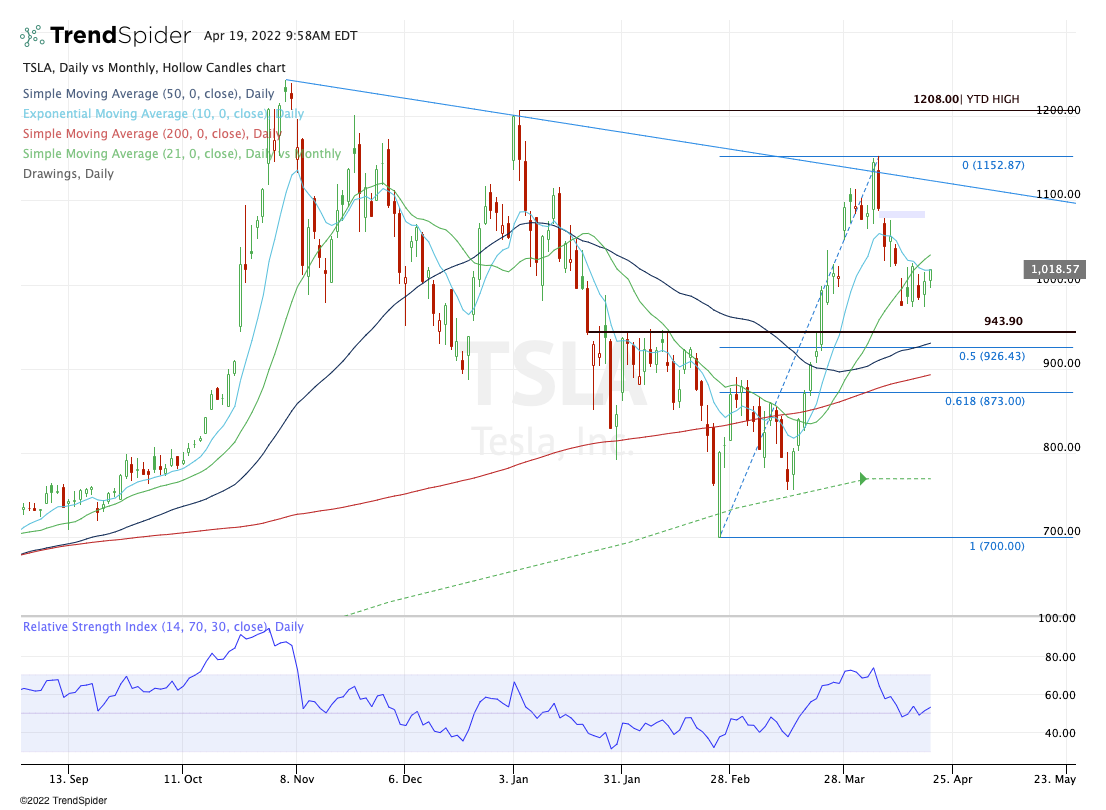
Click to Enlarge
When it comes to the chart of TSLA stock, there are some key levels to know.
The stock is trading below its 10-day and 21-day moving averages, but it’s finding support near $1,000. Now bulls want to see a bullish reaction to earnings, putting the gap-fill level at $1,087 back in play. Above that opens the door to downtrend resistance, then its recent highs near $1,150.
On the downside, TSLA stock has key support sitting between $925 and $945. There it finds the 50% retracement, the 50-day moving average and a prior resistance level. If it fails, it opens the door to the 200-day, then the 61.8% retracement.
TSLA stock below all of these levels could put the 21-month moving average in play.
On the date of publication, Bret Kenwell did not have (either directly or indirectly) any positions in the securities mentioned in this article. The opinions expressed in this article are those of the writer, subject to the InvestorPlace.com Publishing Guidelines.