
It’s not always easy to invest the Magnificent Seven. Electric vehicle (EV) manufacturer Tesla (NASDAQ:TSLA) and its chief executive, Elon Musk, are controversial and not always favored in the investment community. Volatility is common if you own Tesla stock, but understanding TSLA resistance levels can help you to set realistic profit goals.
It’s fine if you want to buy Tesla shares, as the company is huge, famous and well capitalized. However, Tesla has its fair share of issues to deal with, such as challenges in China’s hyper-competitive EV market and questions about whether Tesla’s Cybertruck electric SUV will live up to the hype.
In other words, your enthusiasm for Tesla shouldn’t devolve into complacency. Be ready to exit your Tesla share position at any time — and with the help of TSLA resistance levels, you can know when to say “when.”
Tesla Stock’s Brutal Rejection
A main topic of today’s discussion will be checking the charts on multiple time frames. For example, many stock traders rarely if ever look at quarterly stock charts. Yet, the quarterly Tesla stock chart tells a brutal but important tale of rejection.
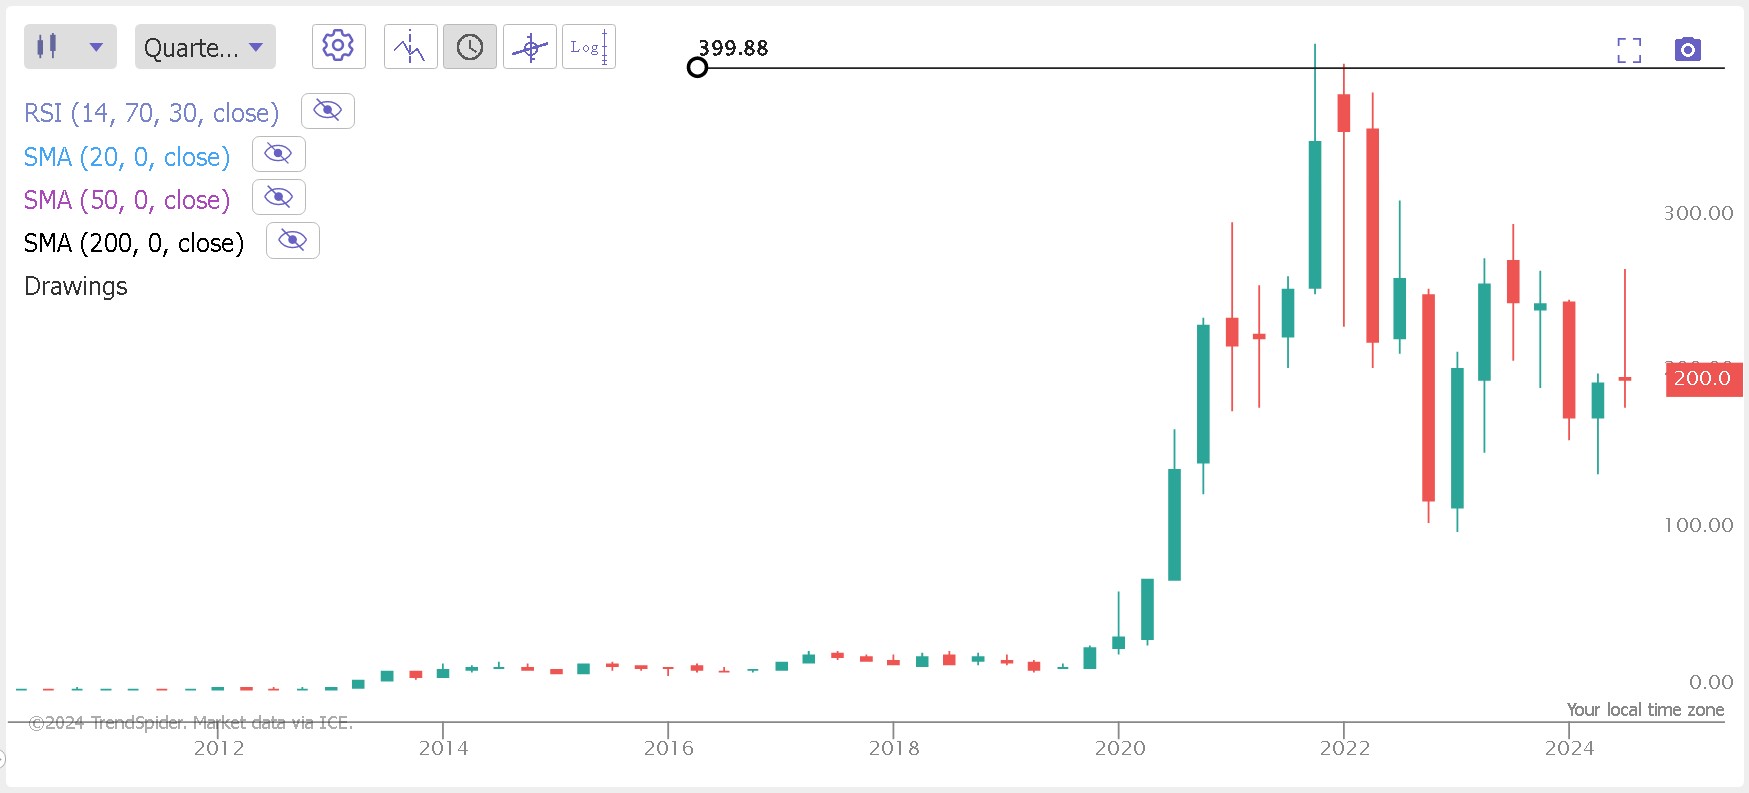
As you can see, it’s been two and a half years since TSLA stock got rejected at the $400 level. Last week, the stock closed at exactly $200. That’s kind of spooky, wouldn’t you agree?
Some technical commentators would say something like, “If Tesla stock gets back to $400, then the sky is the limit!” In contrast, I tend to view $400 as a brutal, multi-year resistance level.
In other words, if you happen to double your money by buying TSLA stock at $200 and eventually selling at $400, thank your lucky stars and take your profits. As the old saying goes, you’ll never lose money by taking profits.
Drilling Down to the Details
$400 can be a long-term objective, but remember to check more than one time frame on your charts. That way, you can set intermediate goals and formulate a more complete exit strategy.
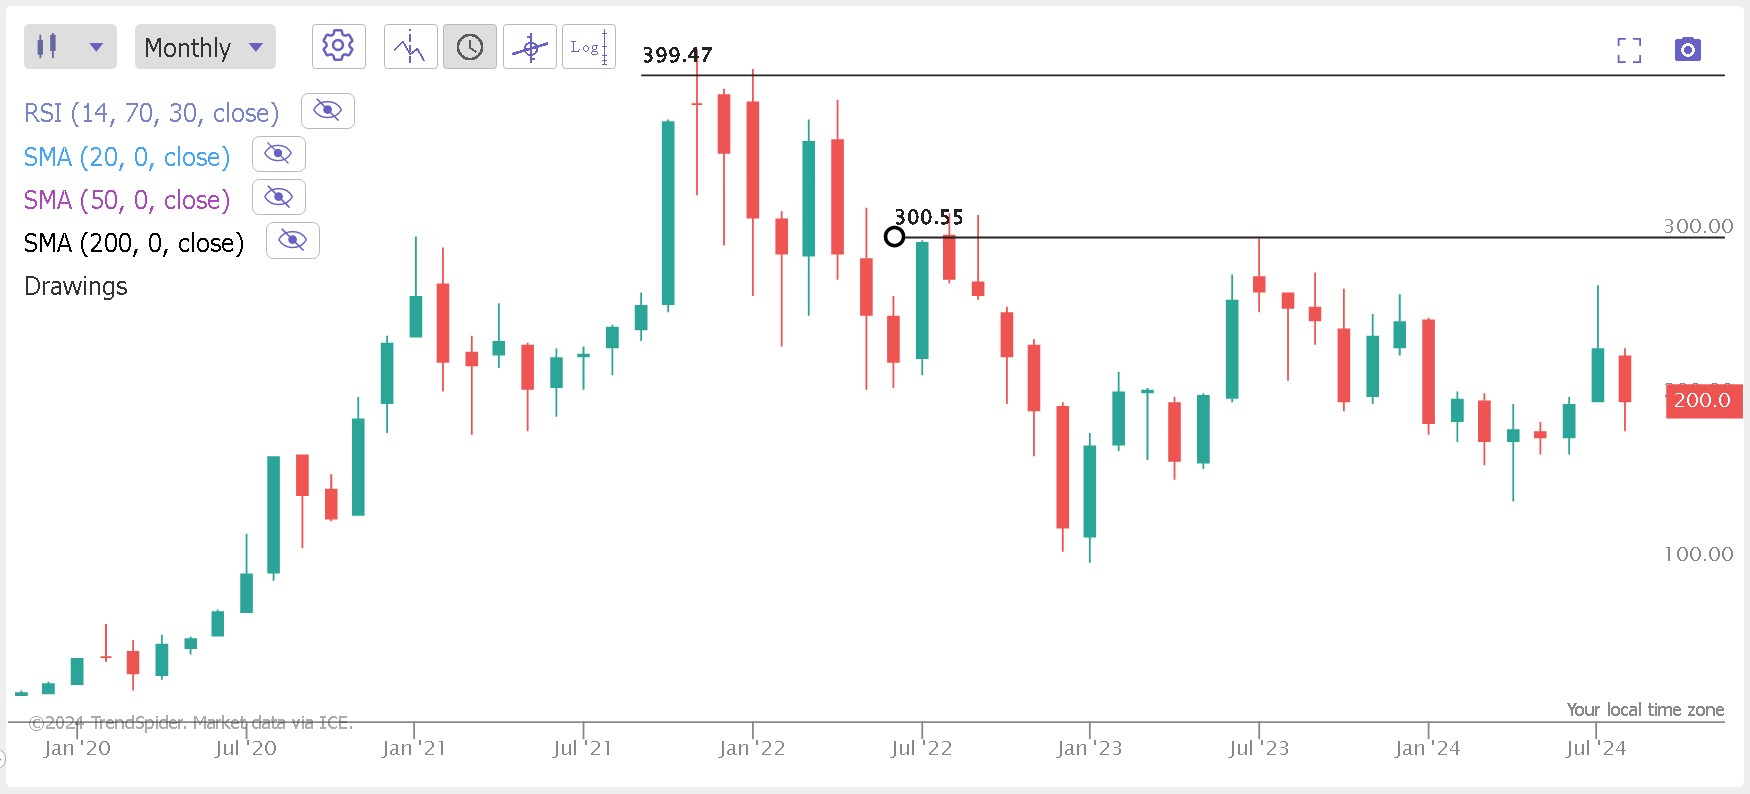
This monthly Tesla stock chart provides more detail than the quarterly chart did. The $400-ish resistance level is still there, but now there’s also an intermediate-term resistance level of around $300. So, it’s $400 and $300, and the stock just stopped at $200 – the coincidences are uncanny!
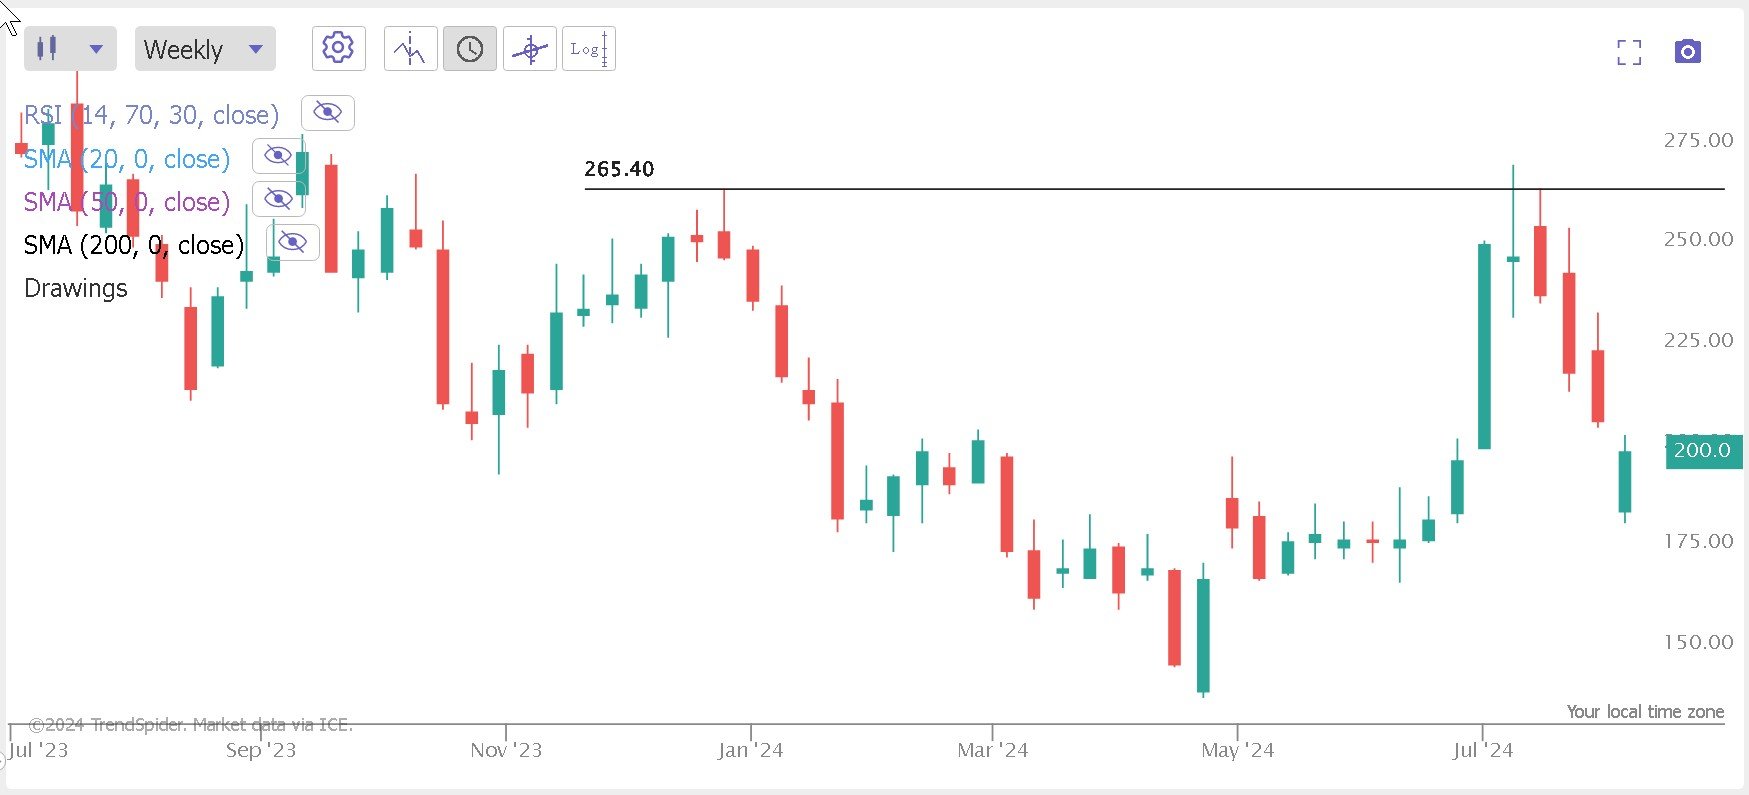
Finally, we’ll get an even more detailed view of the price action with this weekly TSLA stock chart. We’re sacrificing the big-picture view here, but we’re also detecting another resistance level at around $265. Consider this a short-term resistance level to keep in mind over the next few months.
TSLA Resistance Levels: Now You Have a Strategy
Even while you’re keeping tabs on Tesla’s opportunities and challenges, hopefully you’re also checking the price charts. The important thing is to use multiple time frames and consider both the big picture and the finer details.
The aforementioned TSLA resistance levels suggest that prudent Tesla stock investors can take partial profits at $265 and $300. Then, it’s wise to cash out completely at $400. That way, you can still book substantial profits as a Tesla shareholder without risking another ultra-painful rejection from the $400 level.
On the date of publication, David Moadel did not have (either directly or indirectly) any positions in the securities mentioned in this article. The opinions expressed in this article are those of the writer, subject to the InvestorPlace.com Publishing Guidelines.
On the date of publication, the responsible editor did not have (either directly or indirectly) any positions in the securities mentioned in this article.