This Tool Shows You the Best 25-Day Windows to Own Any Stock
In the pre-dawn light along the Maine coast, the work begins quietly. But the stakes couldn’t be louder. More than $700 million rides on what happens next.
That’s why entire communities started their work so early.
As dawn emerges, lobster boats slip out of the harbor, decks stacked with traps, crews moving with quiet urgency. They start this early because timing matters — miss the window, and the opportunity disappears.

Credit: Kirkikis
The lobster fishery anchoring these communities accounted for over $700 million in landings in 2024, with the lobster catch alone worth more than $528 million at the docks — making it the most valuable marine fishery in the nation and supporting thousands of livelihoods up and down the coast.
These fishermen aren’t chasing rumors or guessing where the catch might be – the stakes are too high.
They’re following something far more reliable: the seasonal migration of lobsters, driven by water temperature and instinct older than the boats themselves.
Every spring, as coastal waters warm, lobsters migrate inshore into shallower depths. And every spring, the docks come alive. Traps are set weeks in advance. Processing plants hire extra hands. Fuel suppliers, bait shops, and wholesalers ramp up in anticipation.
Entire coastal towns surge into motion – not because anyone hopes lobsters will arrive, but because they know they will. The rhythm is so dependable that ignoring it would be economic suicide.
No seasoned lobster fisherman would keep setting traps in deep winter waters and blame bad luck when the catch comes up empty.
They understand a simple truth: success isn’t about effort alone—it’s about timing. And those who respect seasonal patterns, understood after generations of effort, don’t just survive year after year… they thrive.
Today, Investors Don’t Have to Wait Decades to Uncover Powerful Seasonal Patterns
We have data. We have computing power. And we can detect cycles that once went unnoticed.
Our corporate partners at TradeSmith are on a mission to give everyday investors access to the kinds of data and analytics once reserved for hedge funds. Their work has uncovered a feature of the stock market most investors overlook: seasonality at the individual stock level.
You can’t see these cycles with the naked eye. They only show up after you run decades of data through powerful algorithms.
What emerges from decades of data is striking: thousands of stocks show historically reliable windows – specific times of year when they tend to rise, and others when they tend to fall – regardless of bull markets, bear markets, wars, pandemics, or panics.
In their latest innovation, TradeSmith has created a rapid-fire trading strategy based on these signals that can pinpoint bullish seasonality windows on 5,000 stocks – to the day. In their backtests, the system’s trades have succeeded with 83% accuracy.
You can try it yourself right now to see the “green day” for 5,000 different stocks when you register for their Prediction 2026 event, which airs next Tuesday, Jan. 20, 2025, at 10 a.m. Eastern.
Reading the Seasonality Chart
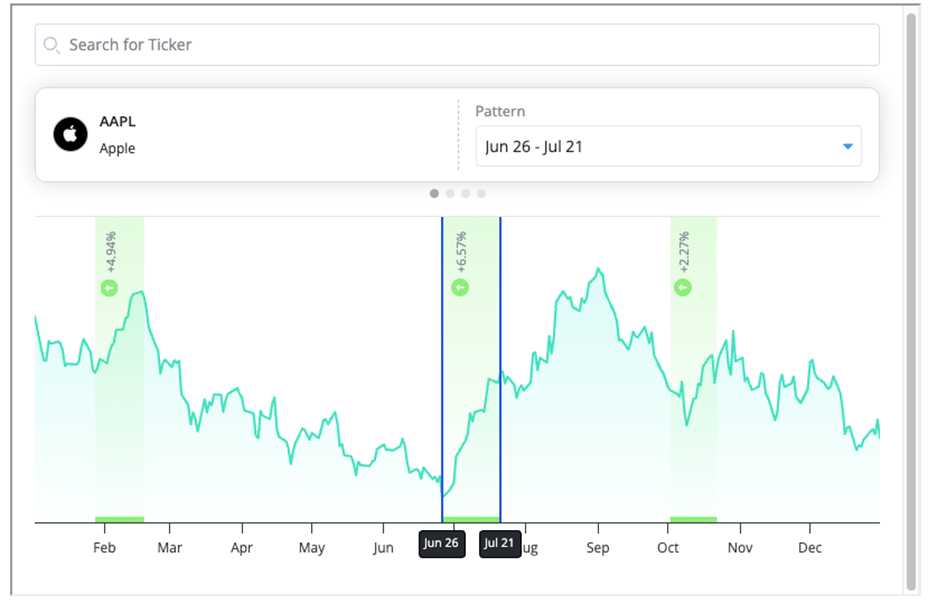
Magnificent 7 stock Apple (AAPL) can provide us with an example of how TradeSmith has made it incredibly easy to read the cycles.
Apple, of course, is a trillion-dollar maker of computers, phones, software, apps, and other consumer devices. Despite the stock’s fluctuations over the years, Apple has seen an average increase of 6.57% between June 26 and July 21, rising 100% of the time over the past 15 years.
You can see the “green zone” pattern below.
That’s how you fish for winning trades.
The data compiled over the years is telling us the best time to buy Apple stock, and the best time to sell it, too.
The chart you’re seeing above is from one of the breakthrough innovations from TradeSmith’s team of researchers, software engineers, and quant investors: their ground-breaking Trade Cycles Seasonality tool.
The development team has fine-tuned this tool to identify seasonality cycles in stocks, stock market indexes such as the S&P 500 and the Nasdaq, as well as in currencies and commodities.
By crunching the data and compiling the historical movements of thousands of different assets, the TradeSmith team runs 50,000 tests daily to analyze every stock in the major indexes. This enables TradeSmith to build a powerful system that helps predict the biggest jumps in 5,000 stocks.
Over an 18-year backtest, these seasonal trades generated a total growth of 857%. That’s more than twice what the S&P 500 delivered over the same time.
The Power of Seasonality Is Now in Your Hands
The best part is, you can sample this start today … right now.
Go here to register for access to an “unlocked” version of TradeSmith’s groundbreaking Seasonality tool. Think of it as a free sample of one of the most powerful investing tools available.
You can explore the results of TradeSmith’s research for the stocks you own or for the stocks on your watch list. It’s available online until Monday, Jan. 19.
Then on Tuesday, Jan. 20, at 10 a.m. Eastern during the Prediction 2026 webinar, you’ll get a live demonstration of how the Seasonality tool can help you find the best time to buy and sell a stock – down to the day.
Go here now to register for the event – and give TradeSmith’s Seasonality tool a try, free of charge, before the big event.
You don’t have to be like the lobstermen of Maine and wait generations to know the patterns that lead to profit. You can utilize data and high-powered computing to gain the edge typically reserved for professionals.
Enjoy your weekend,
Luis Hernandez
Editor in Chief, InvestorPlace