


Last week, yet again, the stock market triggered a rare and powerful technical buy signal. And it suggests, with 95% historical accuracy, that stocks are in the midst of a major breakout.
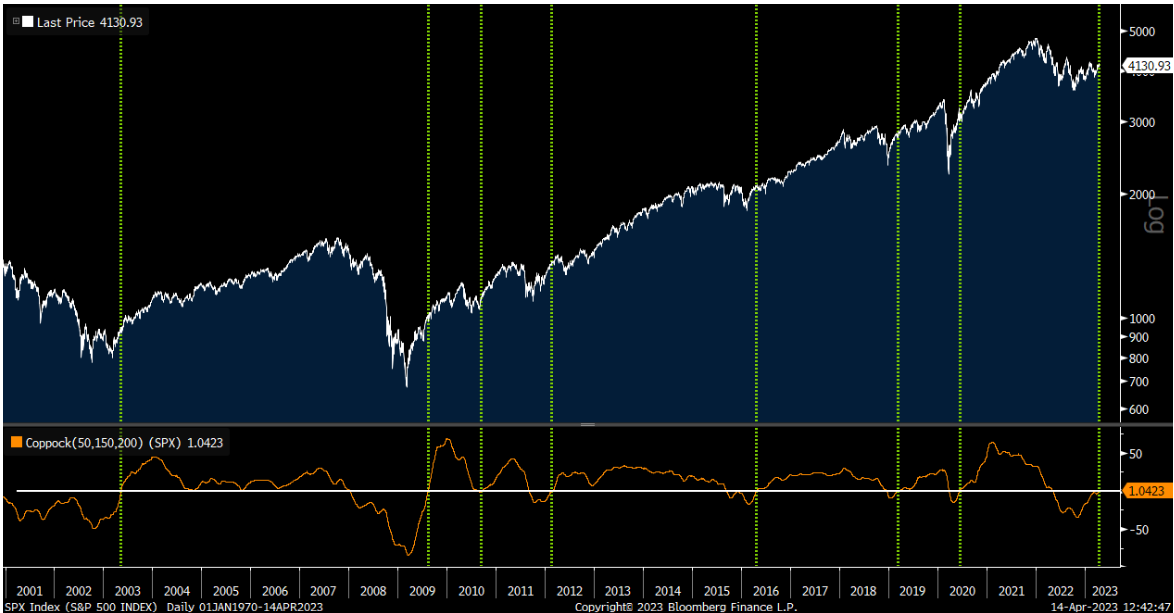
This bullish indicator is called the “Coppock Curve.”
It was developed by renowned market strategist Edwin Coppock in the 1960s to signal long-term stock market trends and, specifically, to identify when bear markets are turning into new bull markets.
At its heart, the Coppock Curve is a momentum oscillator. It uses math to measure medium- and long-term momentum trends in the stock market and tracks changes in those measurements.
When medium- and long-term momentum rises on a persistent basis, the Coppock Curve triggers a buy signal. When they fall on a persistent basis, the Coppock Curve triggers a sell signal.
As stated before, it was designed to identify major shifts in market trend – from positive to negative (sell signal) or negative to positive (buy signal).
And just last week, the Coppock Curve triggered a buy signal, on adjusted parameters.
The Historical Precedence Behind This Bullish Indicator
The same buy signal was triggered as stocks were coming out of the COVID-19 crash, the 2008 financial crisis, and the dot-com crash.
The Coppock Curve buy signal was essentially the “all-clear” sign in each of those major bear markets that the worst was over and better times were ahead.
This bullish indicator was also triggered and gave the “all-clear” at the end of the 1987, 1980-82, 1973-74, and 1968-70 bear markets.
Indeed, it has consistently signaled the end of bear markets.
It has also consistently signaled the start of new bull markets.
Going back to 1970, this specific Coppock buy signal has been triggered 19 different times. In 18 of those instances, stocks rallied over the next three, six, and 12 months. Average returns over the following 12 months were about 16%.
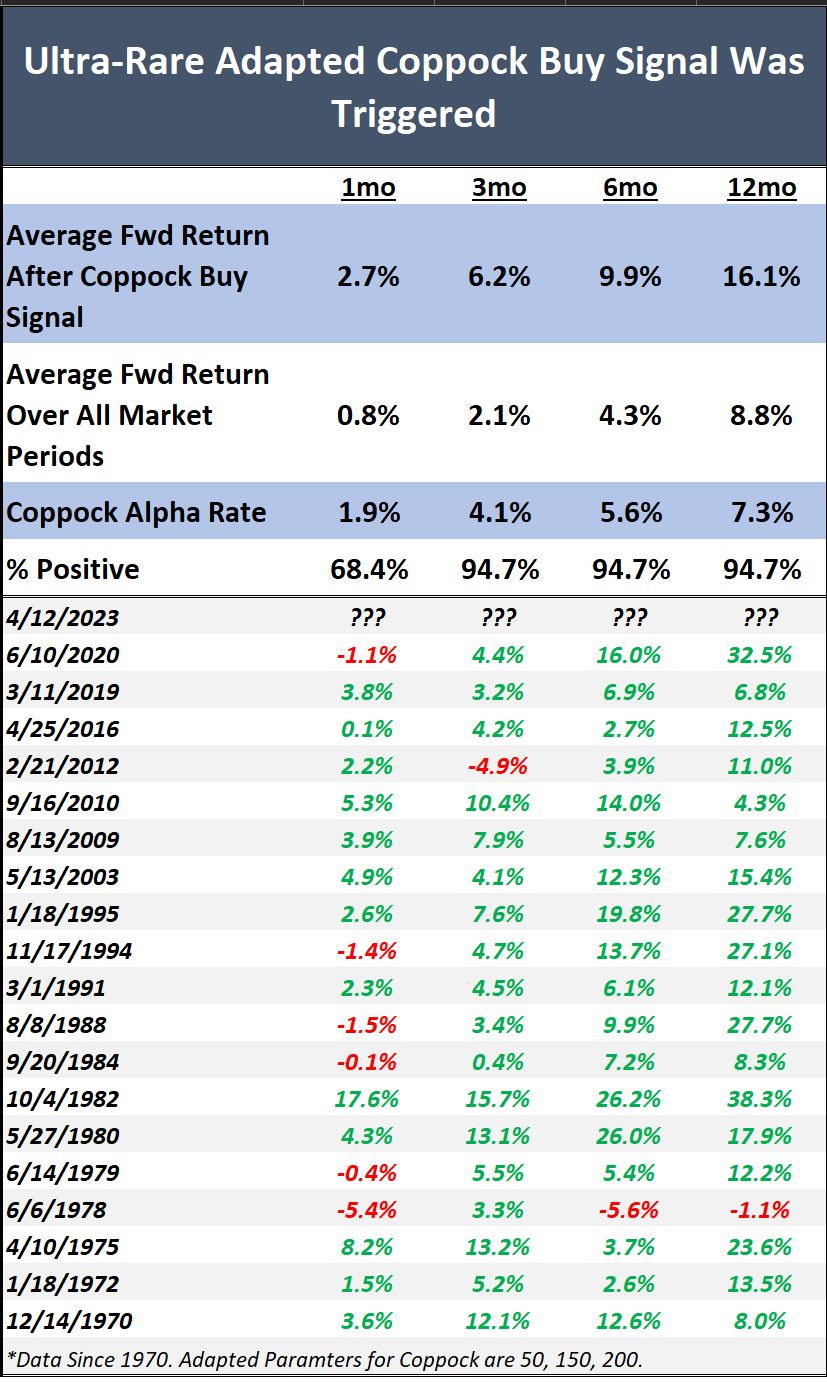
In other words, stocks have been consistently rising for so long now (about six months of steady gains) that history suggests this isn’t just a head fake. Rather, it’s the start of a big stock market breakout.
We agree.
The Final Word on This Bullish Indicator
Red-hot inflation has turned into significant disinflation. Every time that has happened in the past, stocks rallied.
The Fed is likely to pause its rate-hike campaign within a few months. And similarly, every time that has happened in the past, stocks rallied.
Meanwhile, the economy is stable, earnings have been pretty good, and valuations are normal.
The ingredients are there for a massive stock market rally into the end of 2023.
If that happens, then certain individual stocks will rally more than 100% into 2024.
Our job is to find those stocks.
And we think we’ve found just the ones.
Specifically, the U.S. government is developing top-secret technology that some are comparing to the discovery of fire itself.
And one tiny stock is developing the best form of this technology right now.
This stock could be the next Microsoft (MSFT) or Nvidia (NVDA). It has trillion-dollar potential. And it could be one of the stock market’s biggest winners this year.
Learn all about this stock and its breakthrough tech before it breaks out.
On the date of publication, Luke Lango did not have (either directly or indirectly) any positions in the securities mentioned in this article.