The SPDR S&P Oil & Gas Explore & Prod. (ETF) (NYSEARCA:XOP) isn’t the first name in the energy space, but right now, the XOP is the most intriguing.
 Lately, the market has been a tale of two tapes. If the technology sector is your narrator, then it has been a story laced with all-time highs, ebullient price action, and profits raining down on shareholders. Indeed, big-cap tech stocks are partying like it’s 1999.
And yet, if the energy or financial sectors are your guides, then it’s been a sad tale of lackluster performance at best and bearish domination at worst.
It’s the energy sector that I find the most exciting right now, and the posture of the XOP warrants further investigation.
More on that in a minute. First, check out the accompanying sector performance chart illustrating the year-to-date relative performance of the nine major market sectors versus the S&P 500.
The black color of the energy sector column is certainly appropriate, as the space has had “death” written all over it this year. Underperforming the broader market by 20.32% is no small feat!
Traders searching for a bargain are obviously going to have more luck hunting in the energy patch than technology these days. While some participants (perhaps even most) may view the persistent weakness in oil stocks as a reason to avoid the sector altogether, I’m not so quick to cast it off. At some point, money will rotate back into funds like XOP holdings such as Marathon Petroleum Corp (NYSE:MPC) and Exxon Mobil Corporation (NYSE:XOM), the relative weakness will end and a new uptrend will take root.
And given its oversold status, I’m willing to pull out the rod for some good old fashion bottom fishing. Let’s head to the charts to build our case.
XOP Charts
The weekly chart of of this ETF illustrates that the multimonth pullback has retraced just more than 50% of last year’s advance. While it may be a deeper retracement than XOP owners would have liked, it’s still within the realm of typical corrections.
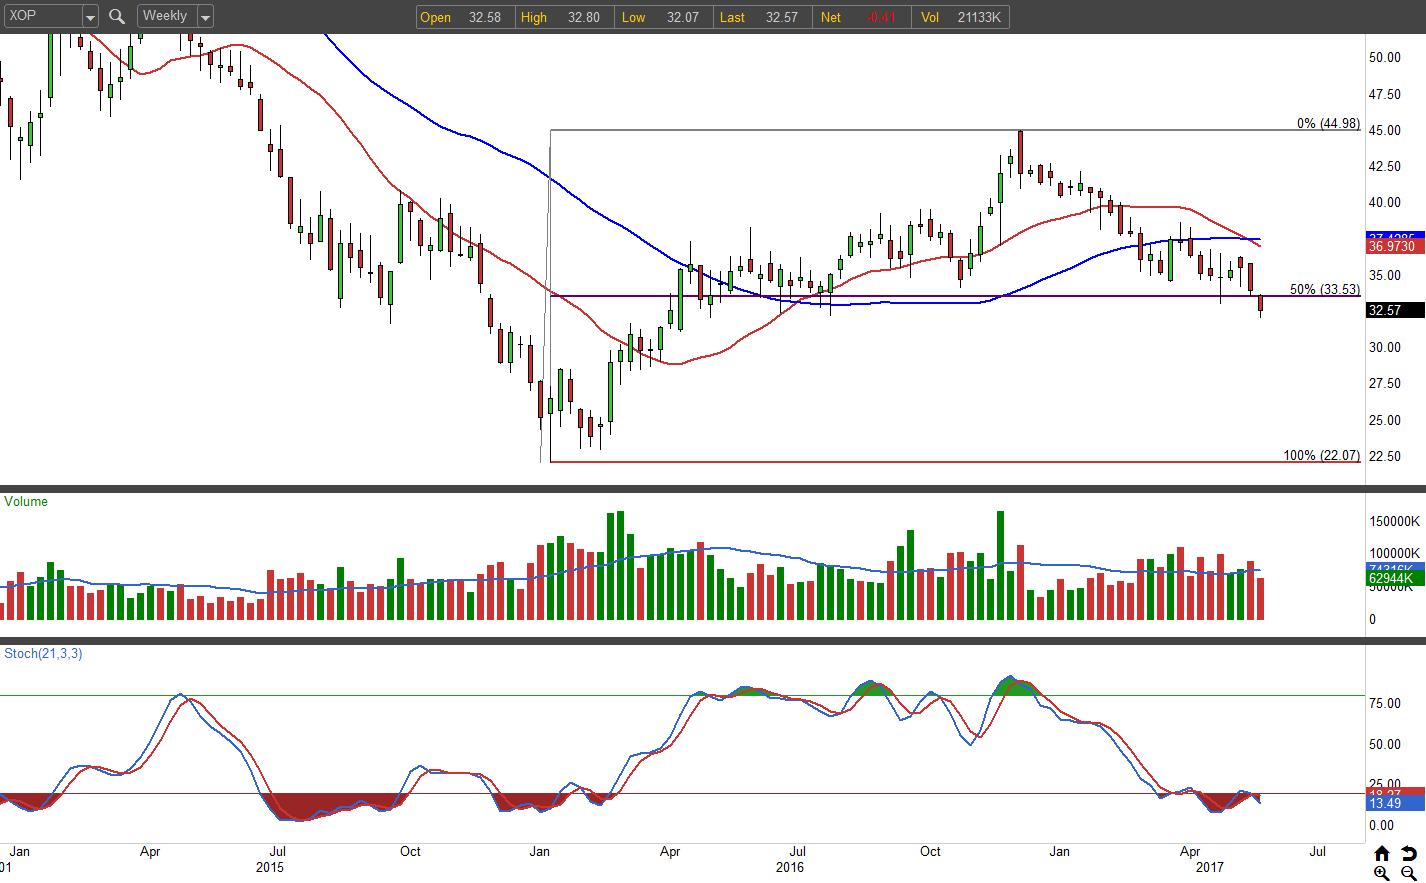
Click to Enlarge
In the lower panel, you can see the Stochastic indicator flashing an oversold signal which confirms prices are stretched to the downside.
Potential support looms large in the $32 zone. Buyers defended this level multiple times last year. Whether they step up again remains to be seen, but Wednesday’s intraday bounce was at least a start. XOP has dropped six of the past seven trading sessions, shedding 9% in the process.
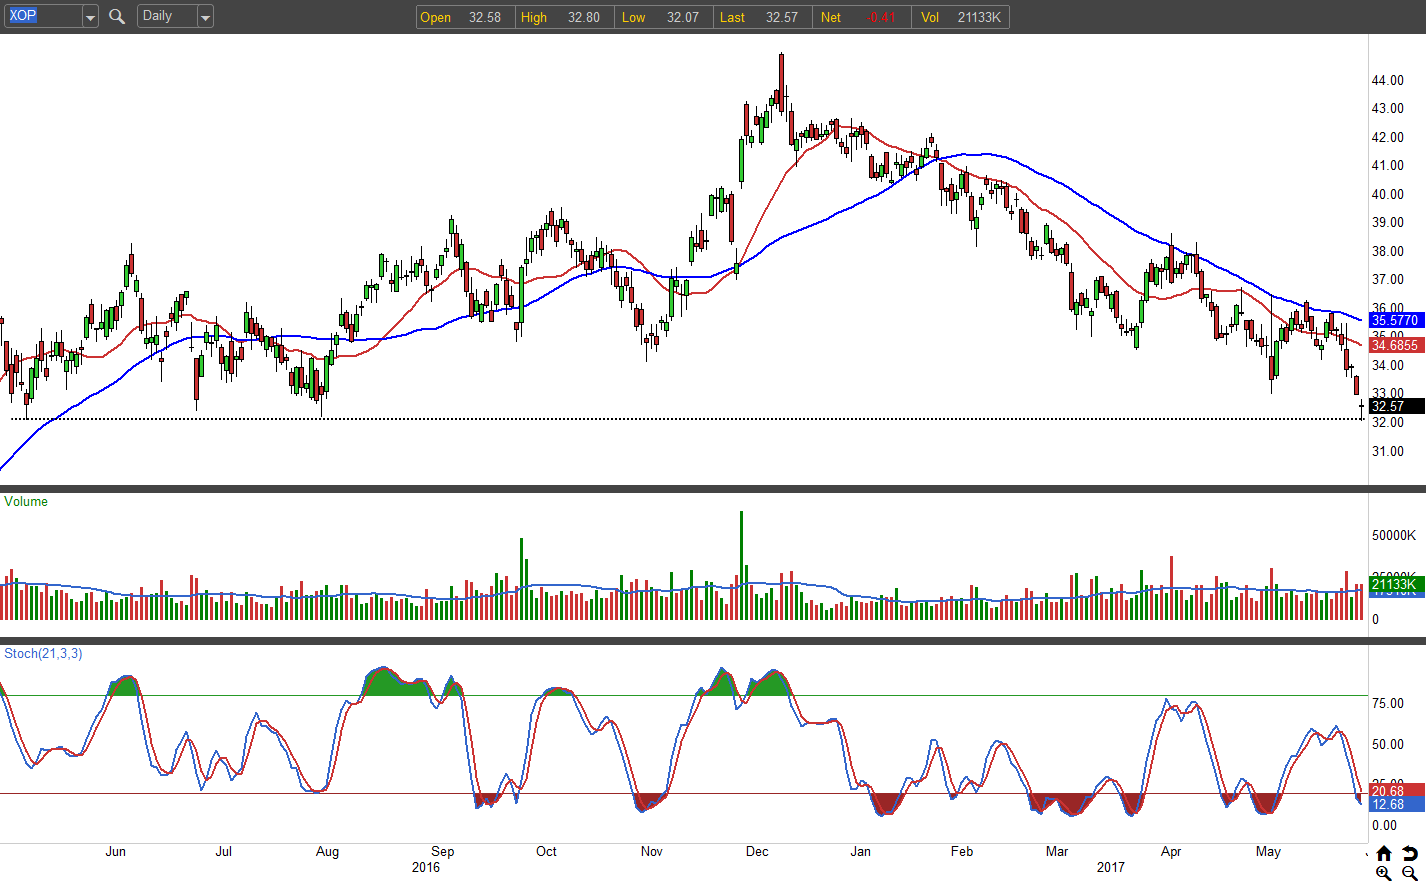
Click to Enlarge
Like the weekly time frame, Stochastics are also generating an oversold reading on the daily chart.
Sell XOP Naked Puts
Throw it all together, and you can see how a contrarian play (i.e., bullish) looks interesting here. My weapon of choice for bottom-fishing in a beaten-down stock is selling naked puts. The elevated volatility in XOP allows us to go a fair distance out-of-the-money when selling a put, which creates a wide profit range.
If you think XOP can remain above $30, then sell the July $30 put for 52 cents or better. The initial 52 cents received represents the max reward and will be captured if the put sits out-of-the-money at expiration.
By selling the put, you are obligating yourself to buy 100 shares at an effective purchase price of $29.48 ($30 – $0.52). If you’re a willing buyer down there, then allow assignment if the put rests in-the-money at expiration. Otherwise, you could buy back the put to close the trade if XOP falls below $30.
As of this writing, Tyler Craig held short option positions in XOP.