With the stock market still flashing signs of potential weakness as it trades at the top of its range, the charts are continuing to identify a large number of bullish and bearish opportunities. It’s a reminder that, hey, there’s always a bull market somewhere.
Facebook Inc (NASDAQ:FB), MeetMe Inc (NASDAQ:MEET) and Activision Blizzard, Inc. (NASDAQ:ATVI) are three big stock charts you should be paying attention to.
Facebook Inc (FB)
Click to Enlarge
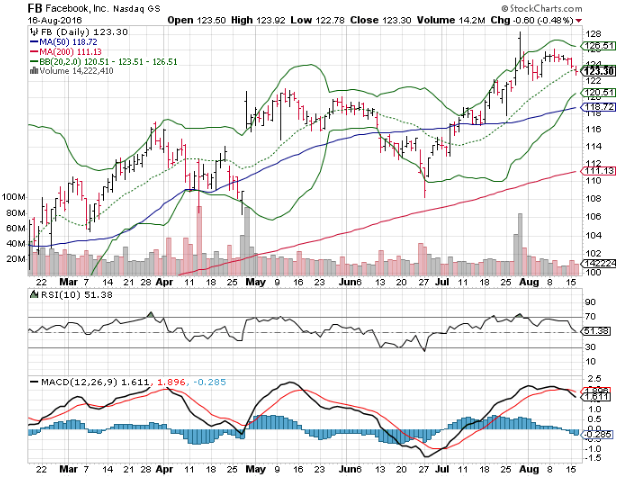
Facebook has been one of the quieter performers in the market lately, especially given the fact the shares normally attract all kinds of attention after earnings. FB stock has made its recent run from $111 to almost $130, setting up a short-term profit taking opportunity for traders.
By three different measures, the FB stock chart is starting to show signs of a transition from short-term bull into short-term bear mode.
First, Facebook chairs are coming off an overbought reading from its RSI indicator, which peaked about two weeks ago when the stock made its final push to $130. The last time that the stock’s RSI was this high was in May after Facebook shares had popped to just under $122 and then started to roll over, eventually selling off to the $111 level before finding a bottom.
Secondly, the momentum indicator for Facebook shares is showing that the recent consolidation just below $122 is more than that, as momentum is starting to swing to the seller’s advantage.
Finally, after an attempt to break above the top Bollinger band in late July, the stock has been held in the tight trading range, which is resulting in a contraction of the Bollinger bands. A contraction in the bands is often a precursor to an increase in volatility, and given the shift in momentum in oversold indications that volatility is likely to be to the downside for FB.
On a last note, Facebook shares recently moved to one of the largest percentage difference between their closing price and 50-day moving average. This often happens ahead of what technicians refer to as a period of regression to the mean.
According to the charts, shifts in momentum and potential selling pressure should lead FB stock back to support at the $116 level in a relatively short period of time.
MeetMe Inc (MEET)
Click to Enlarge
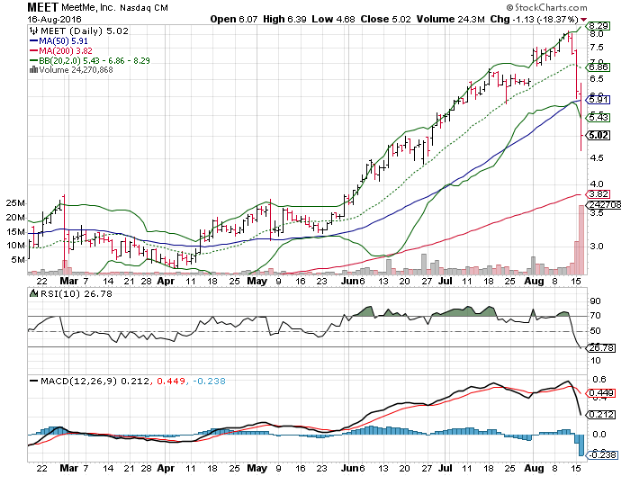
What comes up, must come down, and in the case of MEET stock that’s exactly what’s happening, as it appears the profit takers finally pushed the “sell” button on this parabolic chart ahead of the company’s earnings results, which were announced after the close yesterday. But there’s an opportunity for traders on the massive decline.
In three days, MeetMe shares have saved off about 35% of their value moving from their highs at $8.15 for the current price of $5.02. To many, the 35% pullback would be seen as a disaster, but for those who either sold at $8 or those who haven’t owned the shares, the technical buying opportunity is in the works.
MEET stock has declined into a dramatic, oversold condition that is worthy of a “dead cat” bounce at the minimum, as the RSI is now matching readings that we saw in April ahead of a quick 25% rally in shares. In addition, MEET shares are sitting at $5.00. Low dollar prices (especially single-digit prices) tend to see support and resistance at even dollar prices. The $5.00 point will produce some buying power for the shares.
The best part, the company provided earnings results that were in-line with the market’s expectations last night. This means that the traders that were “selling the rumor” are now likely to be “buying the news”. This fundamental boost will give the shares upside potential over the short-term.
The risk in this situation is that MEET share prices fall below the $5.75 mark, at which point tactical traders will take even a stronger sell signal from adding to the recent selling pressure. A hold of this technically sensitive area will provide traders with an opportunity to jump on this parabolic mover again for a ride back to $8.00.
Activision Blizzard, Inc. (ATVI)
Click to Enlarge
The approaching holiday season has a positive effect on stocks in the retail sector and electronic or software companies that experience revenue increases due to holiday purchases. Traders often load-up on these companies and “buy the rumor”, making the period from Labor Day through Thanksgiving a historically positive one for companies such as Activision Blizzard.
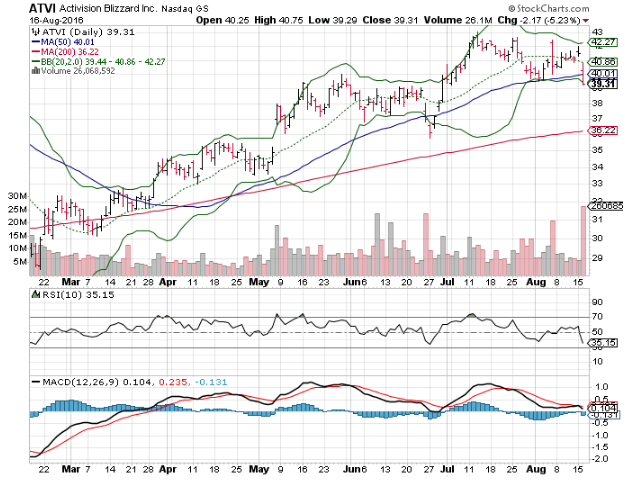
Of course, the stock stumbled about 5% yesterday, but it was on news that the CEO and Chairman had together sold more than $700 million of their holdings in Activision. As expected, the market reacted poorly to the news that the “insiders” were selling, but a key motivation behind the selling may have been overlooked: they did it for estate planning.
The notion that the insiders sell stock because they KNOW it is going to go down is a falsehood that, in this case, has created a technical buying opportunity for ATVI shares.
The relatively meaningless decline in Activision shares places an attractive technical trade right into the investors’ laps.
Yesterday’s selling took the stock right to the bottom of its current Bollinger Band, a line that has been effective in support shares prices in the past. We saw this technical indicator spark rallies in both May and June of this year.
In addition, ATVI broke below its 50-day moving average yesterday, which will get the trendline traders involved. A move back above this level today ($40.00, which is also round-number support) will indicate that the trendline traders are going bullish on Activision.
ATVI stock is also within a pitching wedge shot of registering an oversold reading from its RSI indicator. The last time traders had a chance to initiate a bullish position using an oversold reading of the RSI was in late May.
Technically, Activision is almost a carbon copy of the late May chart that provided a buy signal. This signal resulted in a FAST 10% rally in the shares. Given the weak reason for yesterday’s selling, our conviction is strong that ATVI stock will follow a similar pattern over the next few weeks.
As of this writing, Johnson Research Group did not hold a position in any of the aforementioned securities.