
Shall we be pessimists or optimists today? With our glass half-full, I can hang my hat on the fact that Advanced Micro Devices (NASDAQ:AMD) is my best performer so far for 2018. However, with a glass half-empty approach, it’s easy to focus on the fact that I cut AMD stock way too early, failing to let my winner run far enough.
But in every trade and investment, there’s a lesson to be learned. (For the record, I’m a positive person, so I will chalk up my results as a glass half-full situation with a lesson learned, to boot).
Still, there are plenty of traders who are either in the same position or missed the move altogether. You know, the move where AMD stock ran from sub-$10 in late-April to $34 in early September. That’s right, shares tripled in about less than five months before finally pulling back.
Do the charts now point to an opportunity to get long? It appears so.
Trading AMD Stock Price
Click to Enlarge
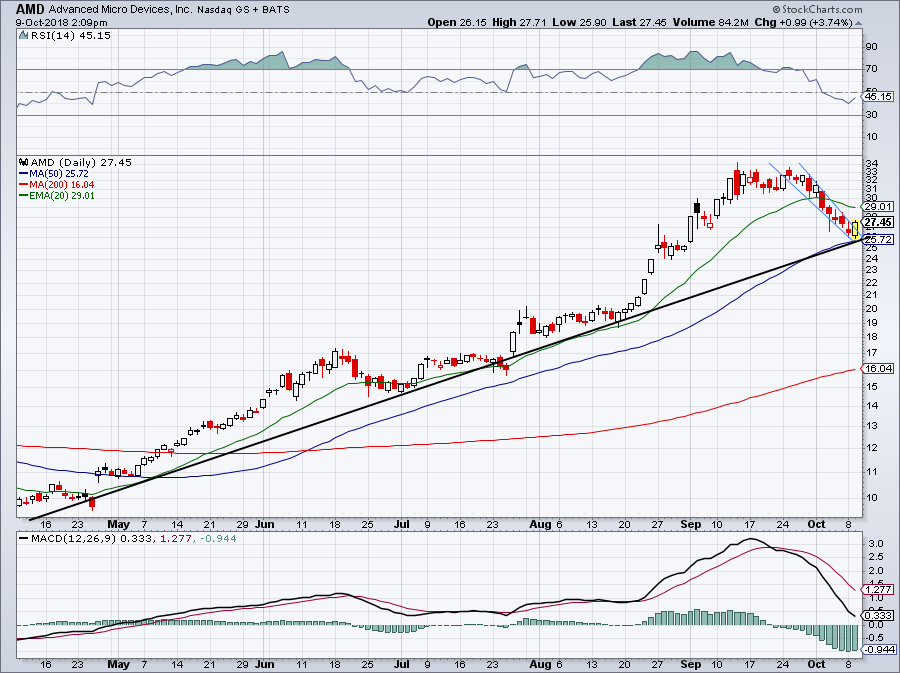
There are a lot of positives here for the bulls, despite AMD stock price pulling back from $33 to $26, a decline of roughly 21%. Take notice of how good of a trending stock AMD has become over the past three to four months. Consistently bouncing on uptrend support (black line) and the 20-day moving average.
However, in October the 20-day moving average stopped acting as support, as AMD stock knifed through $30 on its way to a steeper decline.
In doing so though, it set up AMD for its first test of the 50-day moving average since gapping above it in April. Further, the move coincided with a test of uptrend support. And lastly, it broke out above the descending channel it had formed over the last few weeks.
That’s a buy-signal trifecta right there.
The beauty of this setup? It allows for a rally back to the 20-day moving average at $29 and perhaps even above it if momentum can sustain. More importantly, if the stock breaks down, we have defined risk. A close below uptrend support and the 50-day moving average negates the move and puts us back on the sidelines.
All of this is to say that AMD stock looks good on the long side right now. The one caveat is the broader market. If the SPDR S&P 500 ETF Trust (NYSEARCA:SPY) and PowerShares QQQ ETF (NASDAQ:QQQ
) continue to pullback, AMD may have trouble pushing higher.
Bottom Line on AMD Stock
Advanced Micro Devices has been roaring higher this year and it’s not really clear why. AMD is cutting debt, turning cash-flow positive and earning a profit. But none of that happened in one quick quarter. It’s been slowly working its way there behind the excellent leader that is CEO Lisa Su.
In any regard, bears like to shoot at AMD stock and I’m not entirely sure why. The company doesn’t make top-of-the-line products like Nvidia (NASDAQ:NVDA) but clearly there is a market for AMD products. And no, its price-to-earnings ratio wasn’t as low as Intel (NASDAQ:INTC), but AMD has vastly superior growth.
Further though, AMD wasn’t obnoxiously priced and it had a lower price-to-sales ratio than both Intel and Nvidia. We’ve been making that case for almost a year now on InvestorPlace. In fact, earlier this year we said investors could be buyers of all three stocks if they wanted, but we preferred just AMD and NVDA. That has creates some serious alpha in 2018.
To be sure, there are still two quarters left to be reported for fiscal 2018. Analysts expect earnings to grow more than 175% this year on the back of 26% sales growth. For 2019, it’s no surprise those estimates call for decelerating but still respectable growth of 43% and 10%, respectively. As earnings growth outpaces revenue improvement, look for margins to get better over the next six quarters as well.
Bret Kenwell is the manager and author of Future Blue Chips and is on Twitter @BretKenwell. As of this writing, Bret Kenwell is long AMD and NVDA.