
Square (NYSE:SQ) stock has been on fire…what else is new? SQ has risen 57% in the past three months, 180% so far this year and 224% over the past 12 months. To say this has been a frustrating stock for bears would be an understatement.
Not long ago, Square’s market capitalization was less than $10 billion. Now its market cap is roughly $37 billion. Square stock has been on a run like few others, and eventually stocks that rally to that extent take a rest. Is Square next?
Let’s look at the charts first.
Trading SQ Stock
Click to Enlarge
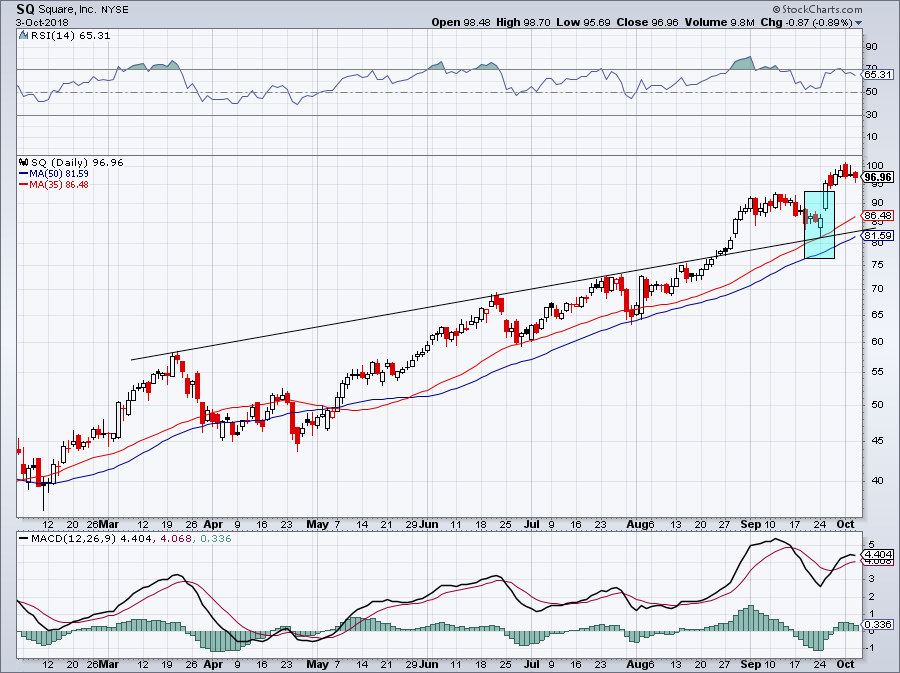
Like Adobe Systems (NASDAQ:ADBE), Salesforce (NYSE:CRM) and others, SQ stock is in a very strong uptrend. Its pullbacks can be volatile and startling, but ultimately the shares have continued to advance. As we’ve said many times in our Top Stock Trades articles, don’t bet against stocks that are trending higher. Instead, buy them on dips.
It’s true that eventually trends will falter, but until they do, it pays to bet with them rather than against them. As the old saying goes, take the path of least resistance. In late August, we said SQ stock could easily burst over $80 and reach the highest price targets on the Street. A few days later, despite seeming to defy logic, we said Square could run to $100 after a pullback.
With SQ, conservative bulls can buy on pullbacks to the 50-day moving average, while aggressive bulls can buy dips that reach the 35-day moving average The latter scenario happened a few weeks ago, as SQ stock pulled back as we expected and then reversed higher after it hit the 35-day moving average. The reversal sprung the stock almost 20% within just a few sessions.
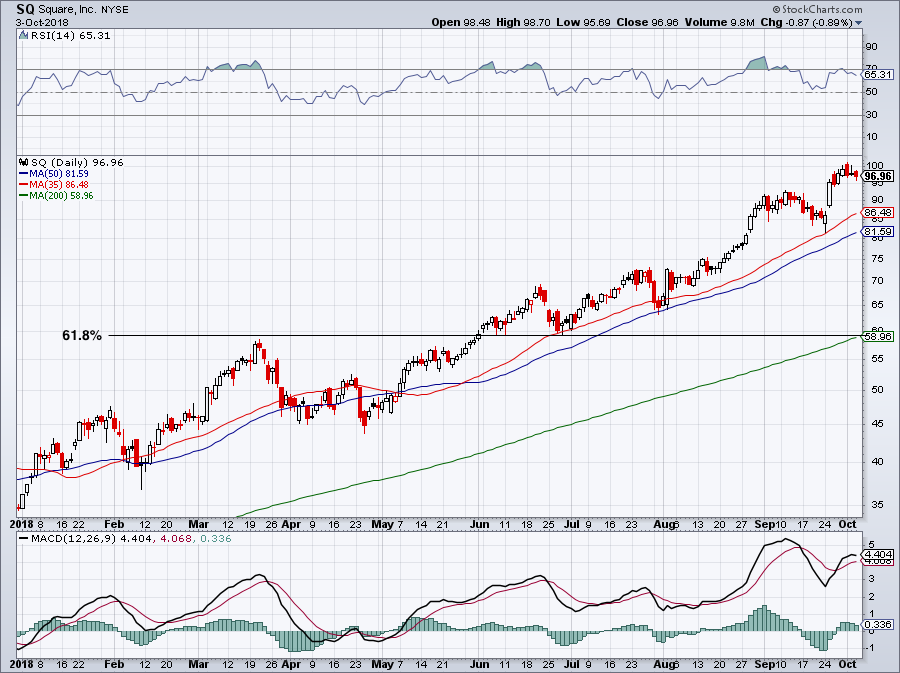
Quite honestly though, I would have loved for SQ stock to have fallen below both of those moving averages. Specifically, a decline to $60 would have made SQ one of the best buys on the market. As you can see on the chart below, such a decline would have landed SQ on three levels of support: the 200-day moving average, the 61.8% Fibonacci retracement and a big prior level of resistance that turned into support. Oh well.
From a trading perspective, keep your approach on SQ stock simple and buy its dips as long as its upward trend is in place. A significant pullback may be looming, but it doesn’t become worrisome unless SQ falls below $80.
Click to Enlarge
Bottom Line on Square Stock
Why do the bears hate Square stock so much in the first place? It’s not because the company makes poor products or because its products aren’t popular. In fact, SQ makes it easy for small- and medium-sized businesses to get up and running. SQ’s payment terminals are easy to use and create a win-win-win scenario for SQ, merchants and customers.
The part that irks the bears is the valuation and the huge gains of SQ stock. Since the start of 2017, SQ has soared more than 600%. While the company has beat earnings and revenue estimates for 12 straight quarters and continues to boost its outlook and execute really well, all rallies have their limits.
Remember that in January 2017 — not that long ago! — SQ stock’s market cap was below $5 billion. Did it really unlock enough value to justify its current $37 billion market cap?
Square’s revenue is expected to surge 58% this year to $1.54 billion and grow another 40% in 2019. On the earnings-per-share front, analysts expect 67% growth to 45 cents per share and an acceleration to 73% growth in 2019. If those estimates prove to be correct, the company will be well-positioned to increase its margins, particularly as its revenue growth decelerates.
The problem, though, is that SQ stock trades at 14 times its sales over the last year and 118 times the consensus 2018 earnings estimate. I see the bears’ point. Comparatively, PayPal (NASDAQ:PYPL) trades at 6.7 times its sales of the last 12 months and 29 times the consensus earnings estimate and has an impressive growth profile, too, although it’s growing more slowly than SQ.
If you want to bet against SQ stock, though, you may want to wait until the trend breaks first. It hasn’t yet.
Bret Kenwell is the manager and author of Future Blue Chips and is on Twitter @BretKenwell. As of this writing, Bret Kenwell held no position in any aforementioned securities.