Another post-Fed beating took stocks even lower on Thursday, and this week couldn’t be over any sooner for the bulls.
The selling pressure continues to take the S&P 500 Index further into negative territory for the year, along with the Nasdaq Composite and Dow Jones Industrial Average. With that in mind, let’s take a look at a few of our best stock charts for Friday:
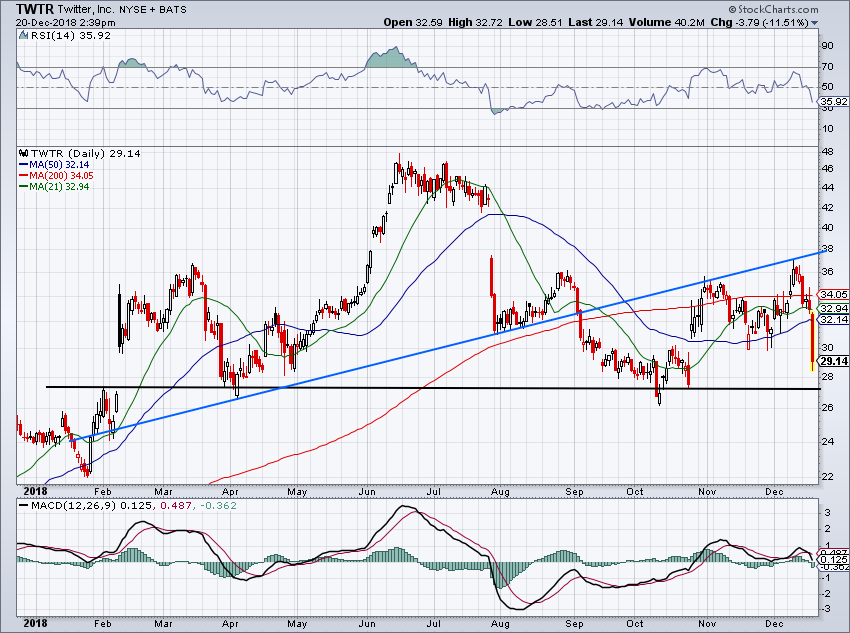
Twitter (TWTR)
Click to Enlarge
Now below $30, the stock has swiftly fallen below all of its major moving averages. Will $27 hold up as support (and is it a bargain)? If it fails, $22 and $24 are in the cards. Should it hold, look for a rebound up toward $30.
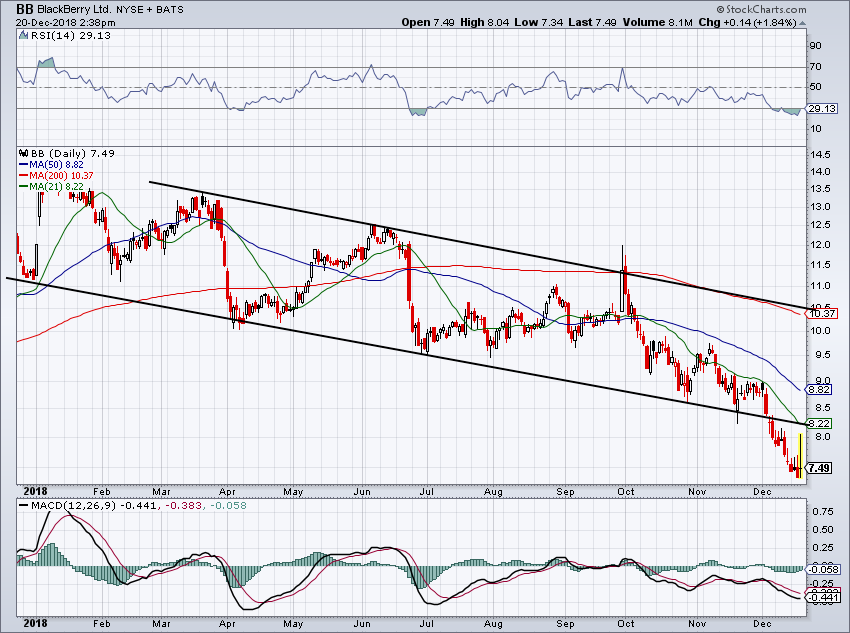
BlackBerry (BB)
Click to Enlarge
Shares didn’t quite make it back to the 21-day moving average and the backside of downtrend support. But it got close before pulling back on Thursday.
Should it rally in the coming days, look to see how it handles these levels. A close above resistance makes BB a long candidate.
A test-and-fail makes it a short candidate with a target of $7.50 and possibly lower.
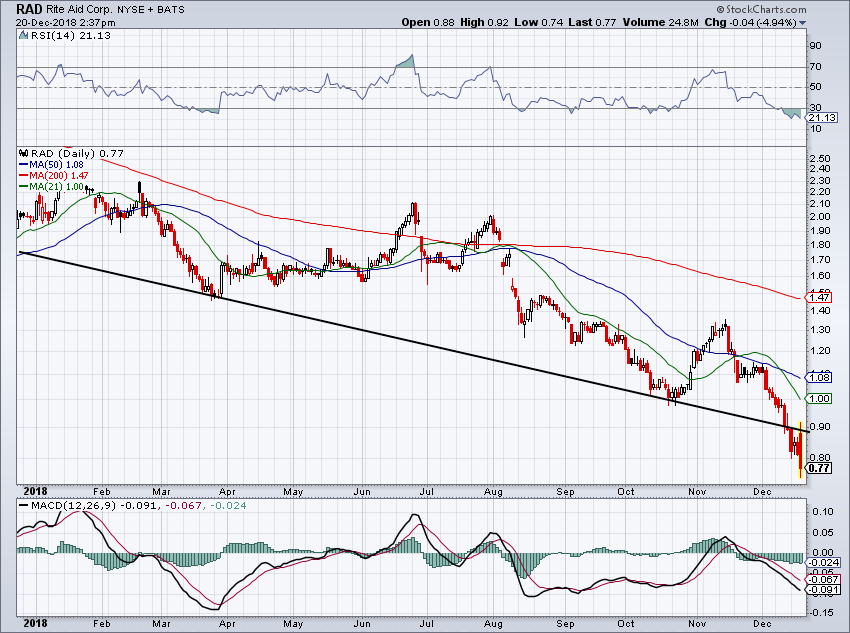
Rite Aid (RAD)
Click to Enlarge
After rallying to 90 cents, shares were quickly smacked lower — just like BlackBerry — as it hit the backside of prior downtrend support. Just don’t mess with this one.
There are plenty of other stocks to buy or short at this point without getting caught up in this RAD mess. For instance, these seven stocks with the strongest balance sheets.
Walgreens (WBA)
Like RAD, Walgreens (NYSE:WBA) beat on earnings and reported in-line revenue results. It also sunk ~5% on the day as a result. In five quick trading sessions, we’ve seen WBA go from a stock above uptrend support (blue line) to one that’s down almost 16% in a week.
Now clinging to the $69 level and 200-day moving average support, bulls are trying to salvage this one. Those who believe WBA is oversold and want a piece of its 11 times forward earnings and 2.4% dividend yield can dip their toe in the water. But just know that a close below the 200-day like sends WBA into the low- to mid-$60s.
On a rebound, we can see $78 if the overall market bounces along with Walgreens.
Disney (DIS)
Disney (NYSE:DIS) was one of the few stock holding up amid this correction. Alas, even the House of Mouse couldn’t help but crumble a bit.
Shares had done a great job consolidating over downtrend resistance (black line), a level that’s been in play for years now. Now below that mark and the 50-week moving average, investors will have to see whether the 200-week moving average will come into play near $102.
On the plus side, the 200-week moving average also lines up with uptrend support (blue line). Should Disney test this level, it would make for a great risk/reward long.
Bret Kenwell is the manager and author of Future Blue Chips and is on Twitter @BretKenwell. As of this writing, Bret Kenwell did not hold a position in any of the aforementioned securities.