
After starting off deep in the red on the first trading day of 2019, stocks were able to recover by afternoon trading. The question now lingers for bulls: will they be able to push the markets higher and keep the bears at bay?
Considering the still-heightened volatility levels, it’s unlikely the market won’t hear bears roar again. Let’s look at some top stock trades for the first time this year.
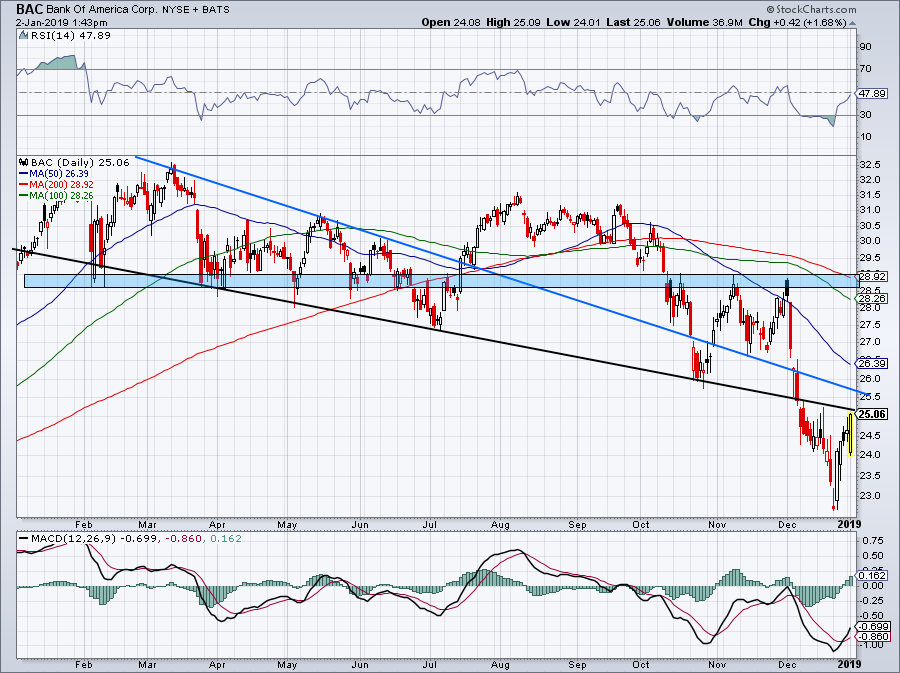
Bank of America Stages Rally
Click to Enlarge
Once the $28.50 to $29 level gave way, shares of BAC have been in a prolonged downtrend. Between $25.10 and $25.50, the stock may have some trouble. A close above this range could ignite a rally, but let’s see how it does over the next few sessions. I don’t want to buy right into resistance.
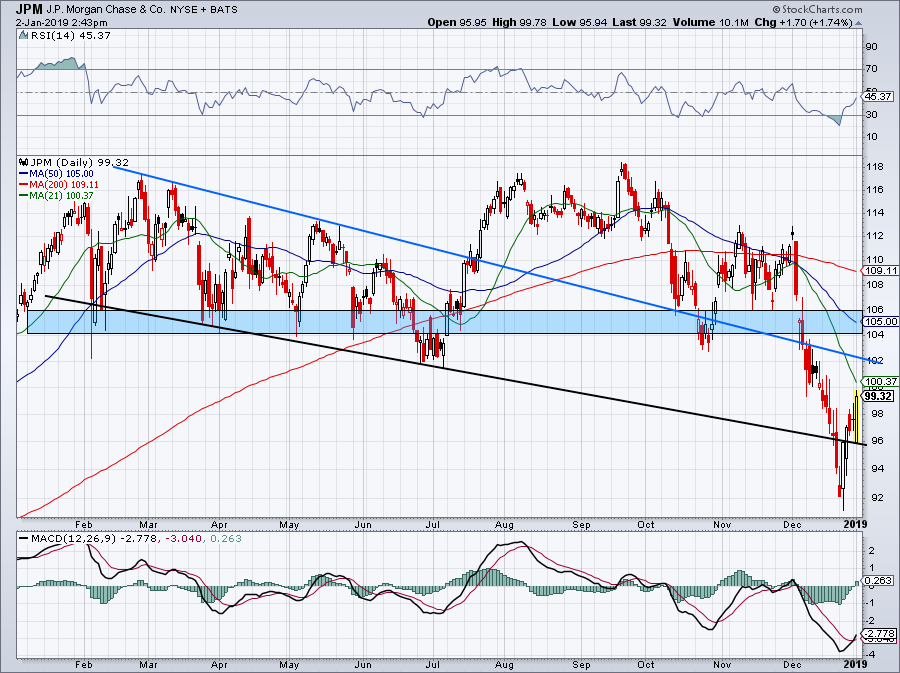
JPMorgan Faces Resistance
Click to Enlarge
Of course, JPM can push through trendline resistance (blue line) and the 21-day moving average and climb back to $104. If it can, that’s good for 4.5% upside. But I don’t know that it’s worth taking that shot, particularly knowing that other resistance is nearby.
That said, I love this name with its low valuation, 3.3% dividend yield and solid growth outlook. I want to see a higher low for JPM and certainly do not want to see it below $92. I’m a short-term seller on a retest of $104 to $106, if it gets there.
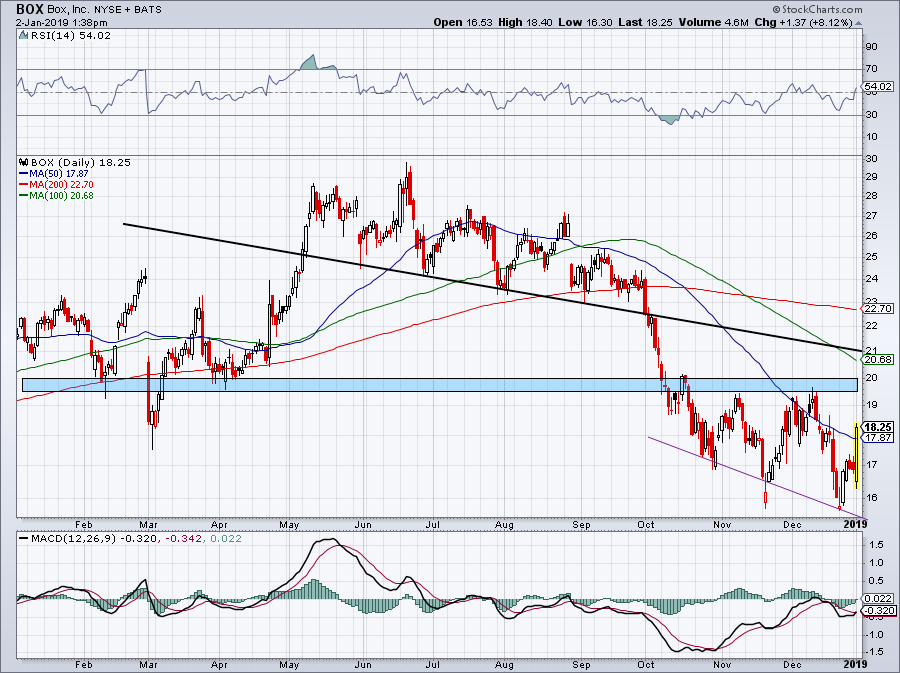
Box Surges
Click to Enlarge
) was a ripper on Wednesday, jumping 8% in the session. The jump thrusts Box over the 50-day moving average and if it can stay over $17, it may just mark the end of the downside.
The move sparked a huge bullish engulfing candle, but concerns linger with the $19 to $20 level nearby. This level was a significant support/resistance level in the past. Will it still hold up as resistance if Box continues to rally?
My guess is yes, but we can re-evaluate it on a retest.
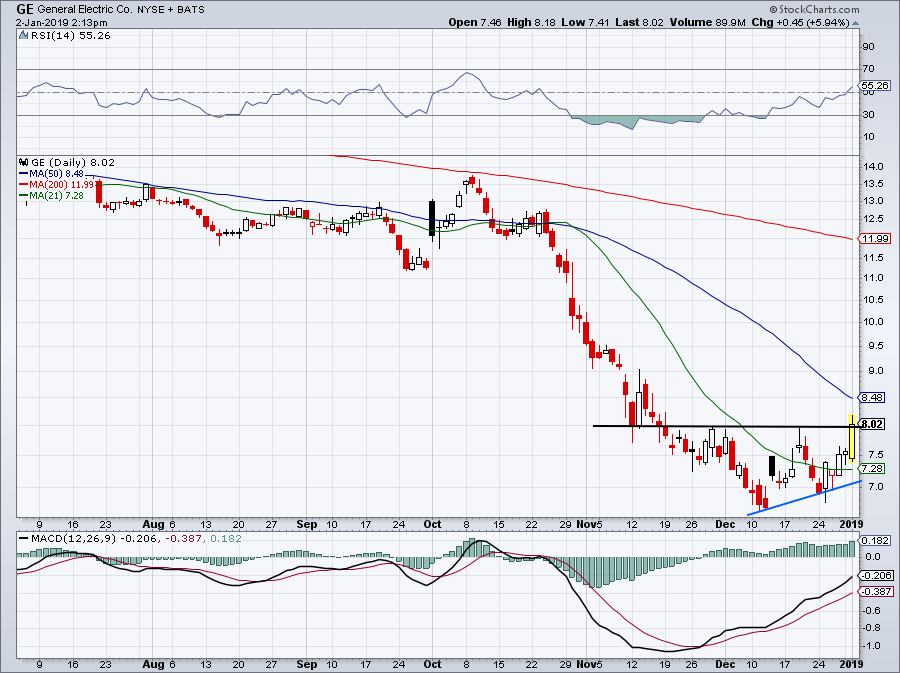
Has General Electric Bottomed?
Click to Enlarge
Down about 80% at one point and GE is far from its glory days. But just as we’ve highlighted a few times over the past couple of weeks, GE has not made new lows with the market. In fact, it put in a lower high, as seen by our uptrend support line (blue line).
The next thing we wanted to see after the higher low was a push through $8. GE is tangling with that level as we speak. Above that and the 50-day will likely be resistance, but if GE can continue to trend higher — slowly but surely — it will help rebuild confidence for the bulls.
Tesla’s Pullback
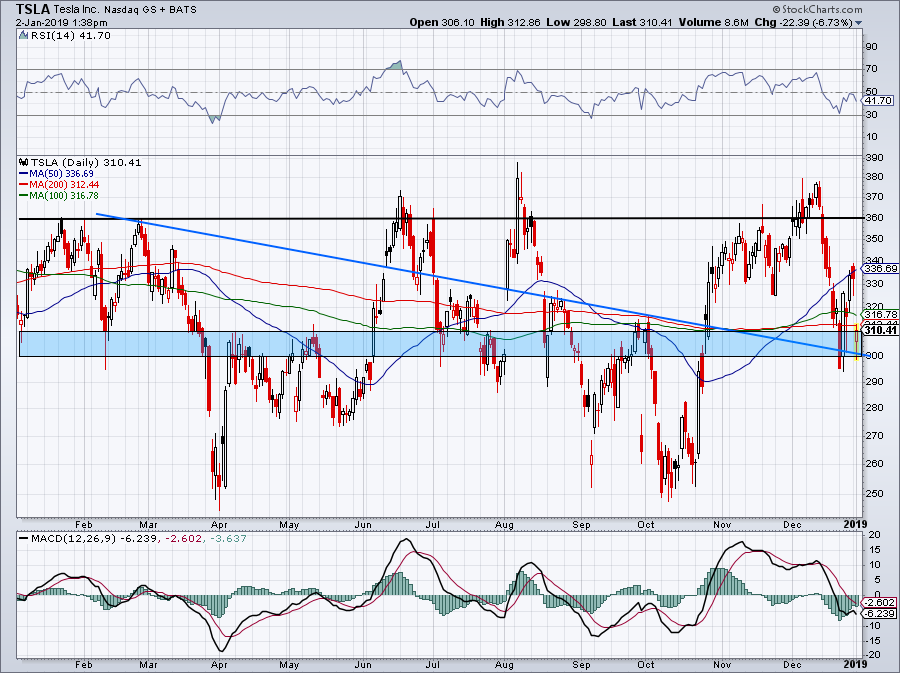
Click to Enlarge
So far, TSLA is holding up above the $300 level — and has been over the past few sessions — but it’s been quite volatile. I am becoming more skeptical of TSLA stock with it below its major moving averages and teetering on this $300 to $310 level.
Above $300 and technically it’s okay though. Below that, and we could get a selloff into earnings. On the plus side, this could set Tesla up as a buy into the print. Let’s see if $300 holds first.
Bret Kenwell is the manager and author of Future Blue Chips and is on Twitter @BretKenwell. As of this writing, Bret Kenwell is long BOX and JPM.