
The broader U.S. stock market as measured by the S&P 500, after a dismal drop into Dec. 26, has since recovered or bounced about 9%. Many areas of the stock market after this initial bounce are now getting near-term overbought and reaching technical resistance areas. Industrial stocks as represented by the the Industrial Select Sector SPDR (NYSEARCA:XLI) are one such area where active investors and traders could now look for short-side opportunities.
I often point out to readers of this here column that stocks are a highly correlated asset class. In other words, when the broader stock market rises say 1% on a given day, most stocks likely go up that day, and the same correlation (or even higher) applies on the downside. This is to say that by picking one individual stock to express ones view on the broader market or on a sector or group of stocks, one has to also deal with the idiosyncratic risk specific to that stock. Conversely by buying/selling a sector or group ETF, this single-stock risk can largely be avoided.
Case in point: at the current juncture in industrial stocks, which as we will see on the below charts in my eye are getting overbought for the near term. One could express a bearish view using one individual industrial stock or just use an ETF that covers the entire space, without dealing with single stock risk.
XLI ETF Charts
Click to Enlarge
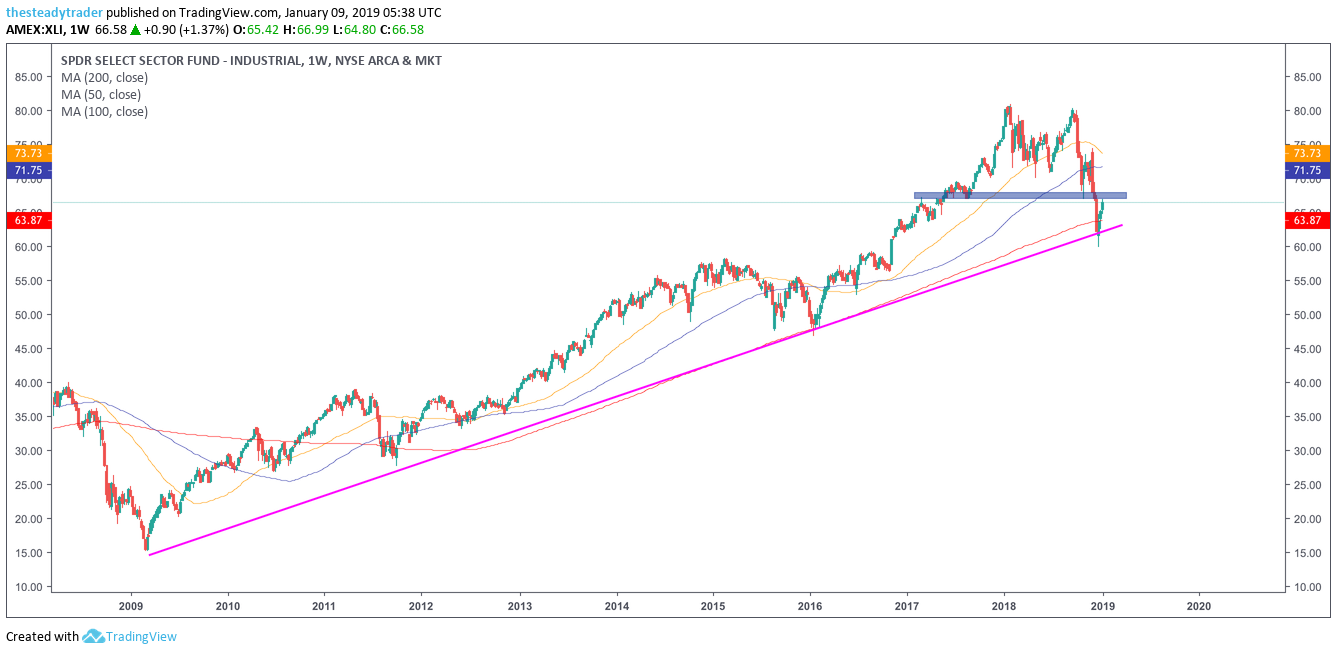
Moving averages legend: red – 200 week, blue – 100 week, yellow – 50 week
On the multiyear weekly chart, we see that the sharp drop in the XLI ETF in the fourth quarter 2018 led it to retrace back to the 2009 support line (pink), which also coincided with the red 200-week simple moving average. Industrial stocks there bounced as they “should have,” but now are entering a first layer of technical support as we will see on the next chart.
Also note that the XLI ETF in September 2018 made a marginal lower high versus its January 2018 high, which through the lens of technical analysis does not bode well for the bulls through a multimonth/quarter time frame.

Click to Enlarge
Moving averages legend: red – 200 day, blue – 100 day, yellow – 50 day
On the daily chart, we see that the recent bounce in the XLI ETF now has it nearing the simple horizontal purple box around the high $60s, which previously acted as support but now could become technical resistance. Furthermore, it is rare for stocks not to at least attempt a second re-test of recent lows after a decline as sharply as we saw in Q4 2018.
Thus, a simple trade idea here in the XLI ETF would be to short it around $68.50-$69, using a stop loss at $70 and an initial profit target at $62.
Get FREE ACCESS to Serge’s renowned Stock Market Scanner with actionable trade ideas. Get it HERE.