
It’s no secret that stocks have rallied hard over the past month. While through a technical lens the broader market is overbought, further marginal upside in the immediate-to-near term cannot be ruled out. Shares of Bed Bath & Beyond (NASDAQ:BBBY) are displaying a high-probability pattern that could lead to further upside for a trade.
Allow me to start with a most salient point for market participants:
At the margin, what separates consistently profitable traders from the rest has to do with the ability to distinguish between different time frames, i.e. keeping trades and longer-term time frames separate. At the same time, and somewhat paradoxically, in order to gain the necessary perspective to keep trades in their respective time frames, it is important to look at stocks in different time frames. To wit, in this here column for the past eight years I have always included charts in multiple time frames, to give you that necessary perspective for proper risk management of any trade ideas.
So, let’s once again apply the multi-time-frame analysis here in this trade idea on BBBY stock:
BBBY Stock Charts

Click to Enlarge
Moving averages legend: red – 200 week, blue – 100 week, yellow – 50 week
A look at the multiyear weekly chart reveals the ugly performance of BBBY stock since topping out in 2015. The longer-term trend is clearly lower and in fact in Q4 2018 the stock even undershot its 2009 lows.
While this trend will take plenty of time to reverse course (if and when it does) in the bigger picture, note that downside momentum most recently bottomed in late 2017 and made a higher low in late 2018 (MACD momentum oscillator at the bottom of the chart).
Click to Enlarge
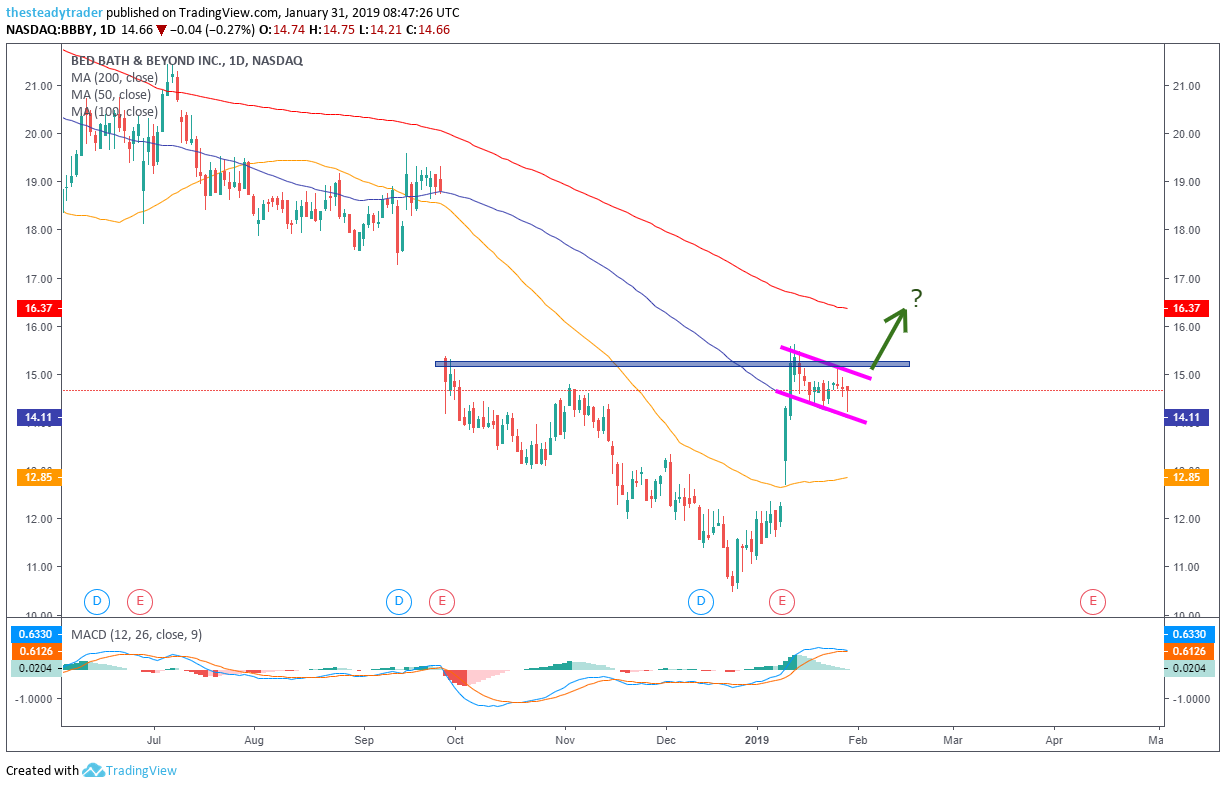
Moving averages legend: red – 200 day, blue – 100 day, yellow – 50 day
With that multiyear chart in mind we can now zoom into the daily chart with the proper mind set.
Here we note that after a dismal end to 2018, BBBY stock rallied and gapped higher on Jan. 10 following its latest earnings report. While the post-earnings rally only lasted two days, the sideways consolidation since increasingly looks to lead to another leg higher in the stock. Note that the low of the consolidation pattern marked by the two purple parallels also coincides with the blue 100-day simple moving average and the upper end is right at a simple horizontal line of resistance.
The trade setup is straightforward: Buy BBBY stock upon a break and hold above $15.30. First upside profit target is $16.40. Stop loss is at $14.20.
Get FREE ACCESS to Serge’s renowned Stock Market Scanner with actionable trade ideas. Get it HERE.