Shares of United Technologies (NYSE:UTX) rallied nearly 5.3% on Wednesday following the company’s latest earnings report. While the set up for more upside on the surface looks good, UTX stock as a result of this latest pop has now also rallied into a major area of technical resistance where upon a bearish reversal active investors and traders could look on the short side of the stock.
One of the pillars of my approach to trading and investing in stocks is the understanding that the stock market as a whole is a highly correlated asset class. While it is entirely possible to find stocks that completely diverge from the masses, the reality is that at any given point around 70%-80% of stocks will trade up and down together directionally. As such, my analysis of stocks always starts with the broad market first and then digs deeper into individual sectors, industry groups and eventually into single name stocks.
To wit, shares of United Technologies have rallied along with the broader market as represented by the S&P 500 for the past few weeks and thus through the lens of technical analysis look eerily similar in that they are near term overbought with marginal upside left for the time being.
UTX Stock Charts
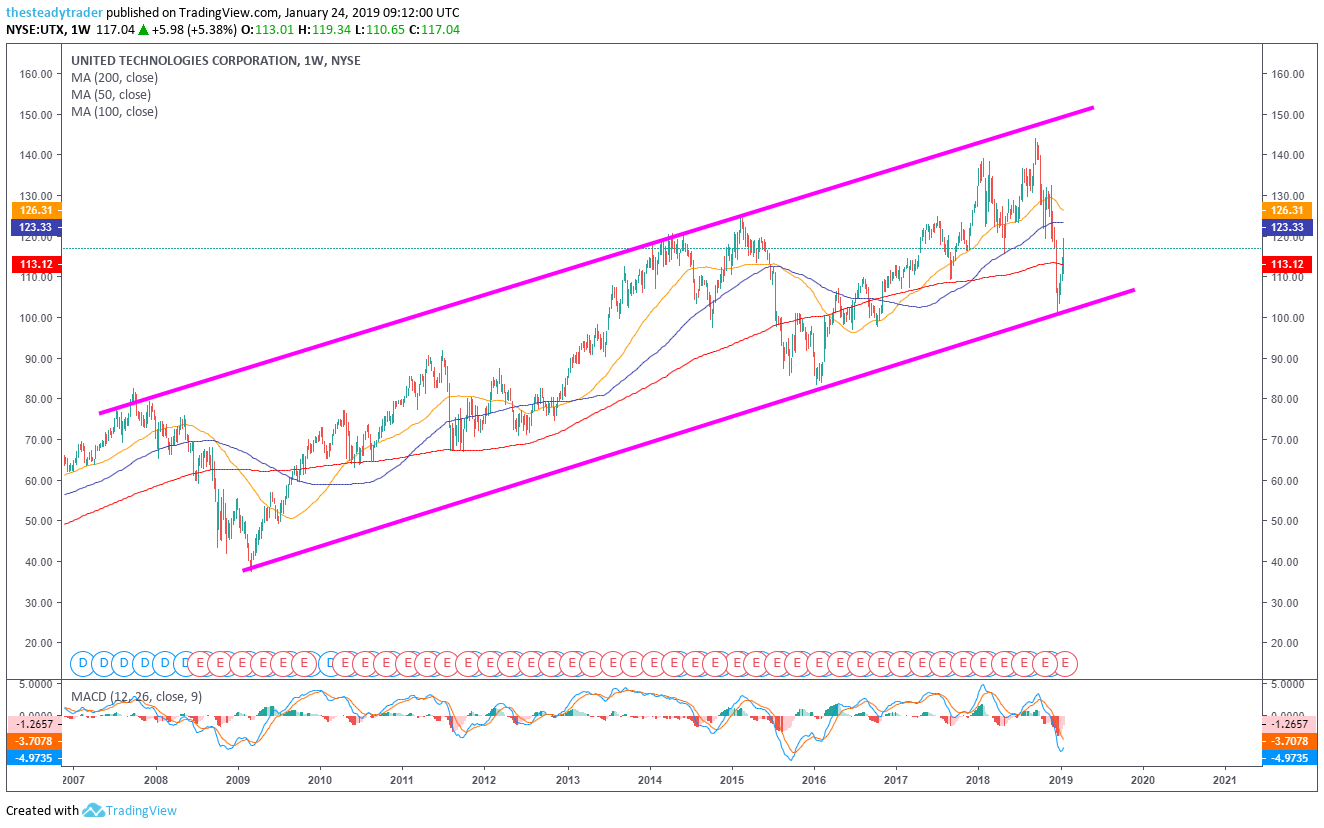
Click to Enlarge
Moving averages legend: red – 200 week, blue – 100 week, yellow – 50 week
Before looking at a particular trade setup, let us gain some perspective from the big-picture multiyear weekly chart. Here we see that UTX stock in late 2019, along with the broader stock market, plummeted right into its long-term 2009 support line and thus also retested the lower end of the up-trending channel for the first time since early 2016.
The stock has bounced strongly since and, while still vastly oversold from a momentum perspective, on this chart is definitely reaching a layer of technical resistance on the daily chart.
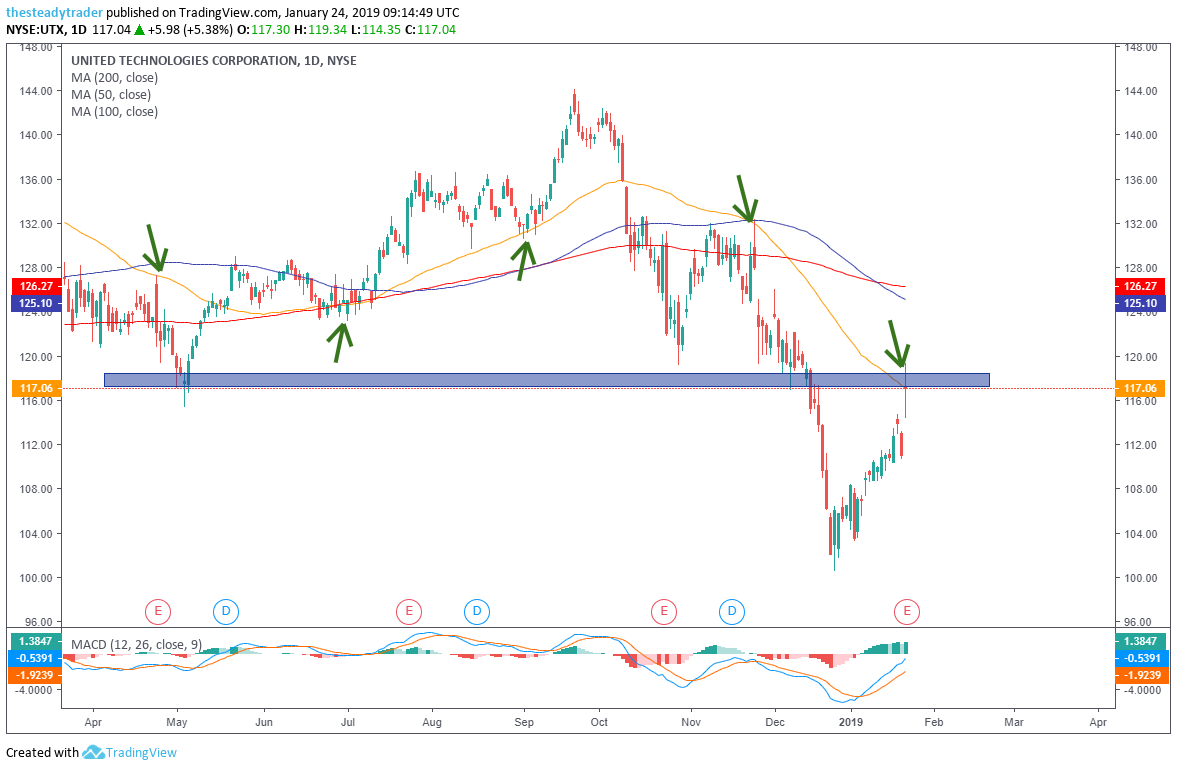
Click to Enlarge
Moving averages legend: red – 200 day, blue – 100 day, yellow – 50 day
On the daily chart, we see the recent bounce a little more clearly. UTX stock since late December has now rallied just shy of 20% and on an intraday basis on January 23rd reached a well-defined area of simple horizontal resistance (blue bar) around the $120 area.
Also note that the stock on Jan. 23 closed the day for trading right at its yellow 50-day simple moving average, which as can be seen on the chart that I marked with green arrows has offered a good reference level for support and resistance since the spring of 2018.
From here, active investors and traders could leg into short-side bets in UTX stock once it gives a bearish reversal, i.e. a next down day of at least 1%-2%. This would confirm the aforementioned technical resistance and then allow a downside target at $110 and a stop loss at $120.
Today I will hold a special webinar for InvestorPlace readers showcasing a high-probability stock market income strategy. Click here to register for this free event.
Free Webinar: Stock Market Income Strategy – steady supplemental or primary stock market income. Click here to register for this free event.