
The financial sector of the S&P 500 has risen sharply along with the broader stock market over the past two months. While I have my concerns on this sector through a multimonth lens, in the near term, stocks such as Goldman Sachs (NYSE:GS) are eyeing a well-defined next upside target. Specifically for GS stock, it is the 200-day simple moving average that looms large.
Markets are complex mechanisms for the most part, and while I preach keeping it as simple as possible, I often see that many retail investors and traders only gaze a a few moving averages and then, based on that, put on their trades. In instances such as the one I am about to discuss here, however, it can make sense to use a specific price target or a moving average as a simple price attraction level.
Let’s have a look at the charts:
GS Stock Charts
Click to Enlarge
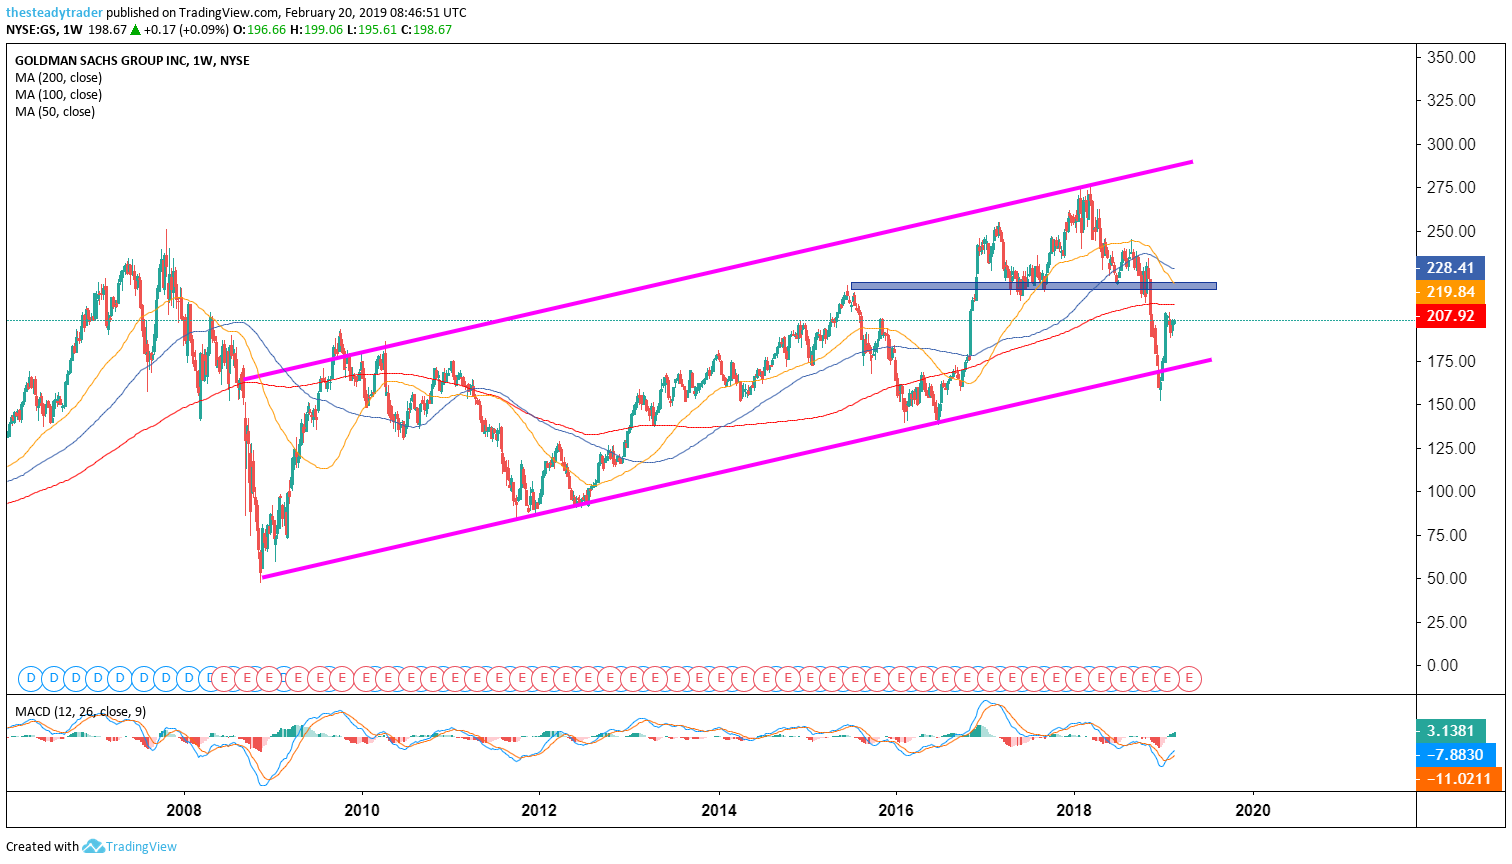
Moving averages legend: red – 200 week, blue – 100 week, yellow – 50 week
For context, I always start off with a bigger-picture view of both the absolute as well as the relative chart. In this case, we are looking at the multiyear chart of GS stock with weekly increments. Note that the price movement since the late-2008 lows has largely taken place within a well-defined up-trending channel.
By early 2018, the stock had reached and marginally breached the very upper end of this range, and by late that year, it had reached and marginally breached the very lower end. The recent bounce off the lower end has been sharp, and I think the early 2018 highs are a long ways away from being seen again.
In the near-term, however, should performance anxiety on the part of fund managers continue to percolate then a marginal further squeeze higher in GS stock and other financials could well take place.
Click to Enlarge
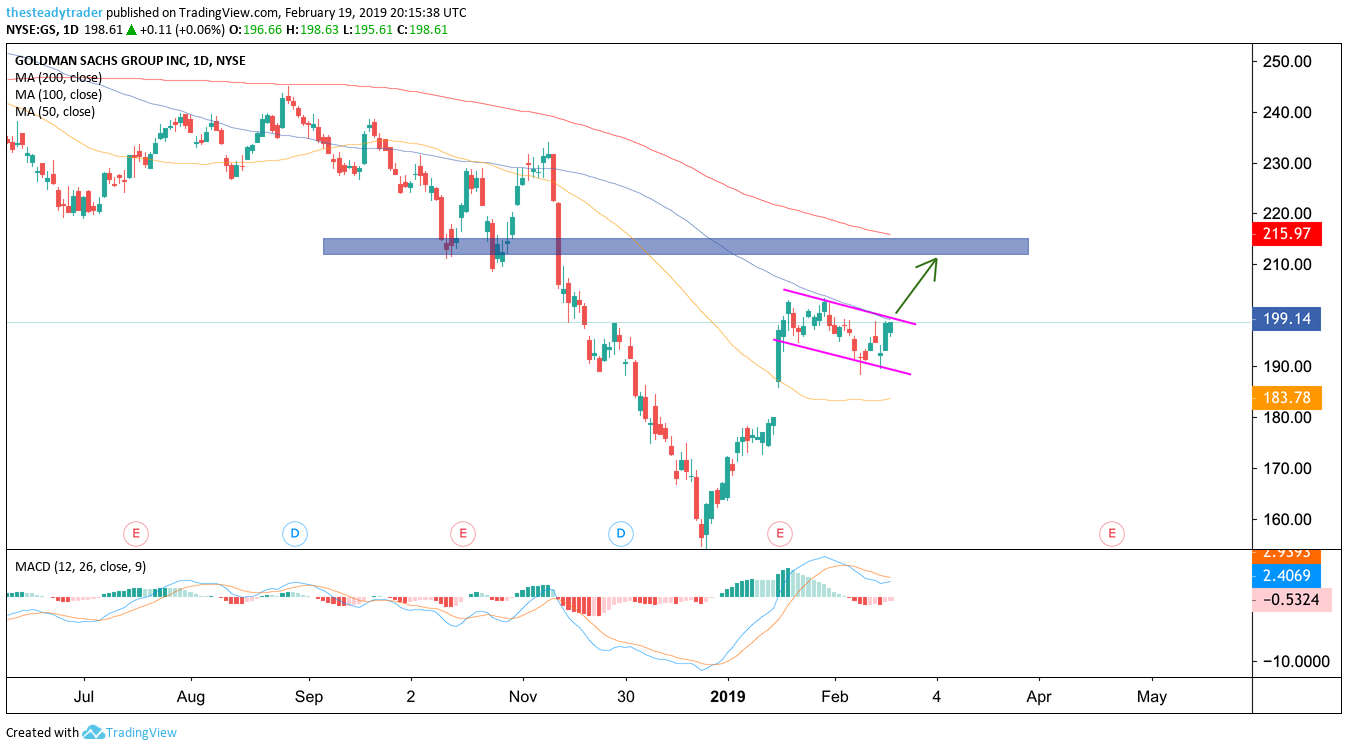
Moving averages legend: red – 200 day, blue – 100 day, yellow – 50 day
On the daily chart, we see that GS stock after an already sharp rally into early January proceeded with an up-gap and rally following its latest earnings report. For the past month, however, the stock has largely trotted sideways and consolidated those early January gains. Through the lens of technical analysis, this consolidation period has taken the shape of a so called “bull flag pattern” that also is taking place right below the stock’s blue 100-day simple moving average.
If and when the stock can clear the $200 area on a daily closing basis, then a trade higher toward $210 and possibly $215 could unfold. Any sharp one-day bearish reversal, particularly if in conjunction with a broader market sell-off, would be a stop loss signal.
Get FREE ACCESS to Serge’s renowned Stock Market Scanner with actionable trade ideas. Get it HERE.