After taking some major heat both in terms of headlines and in its stock price in 2018, Facebook (NASDAQ:FB) so far in 2019 is higher by 29% already. Through the lens of near-term technical analysis, barring any major new headline bombs FB stock looks to have higher to go.
A simple but often overlooked part of technical analysis of stocks, bonds and other asset classes is that its application in my eye is more art than science. In other words, the propensity for a stock to over or undershoot specific technical support or resistance areas at least marginally is high.
Thus it is so crucial in my eye to gain perspective in multiple time frames so as to properly interpret any price action.
FB Stock Charts
Click to Enlarge
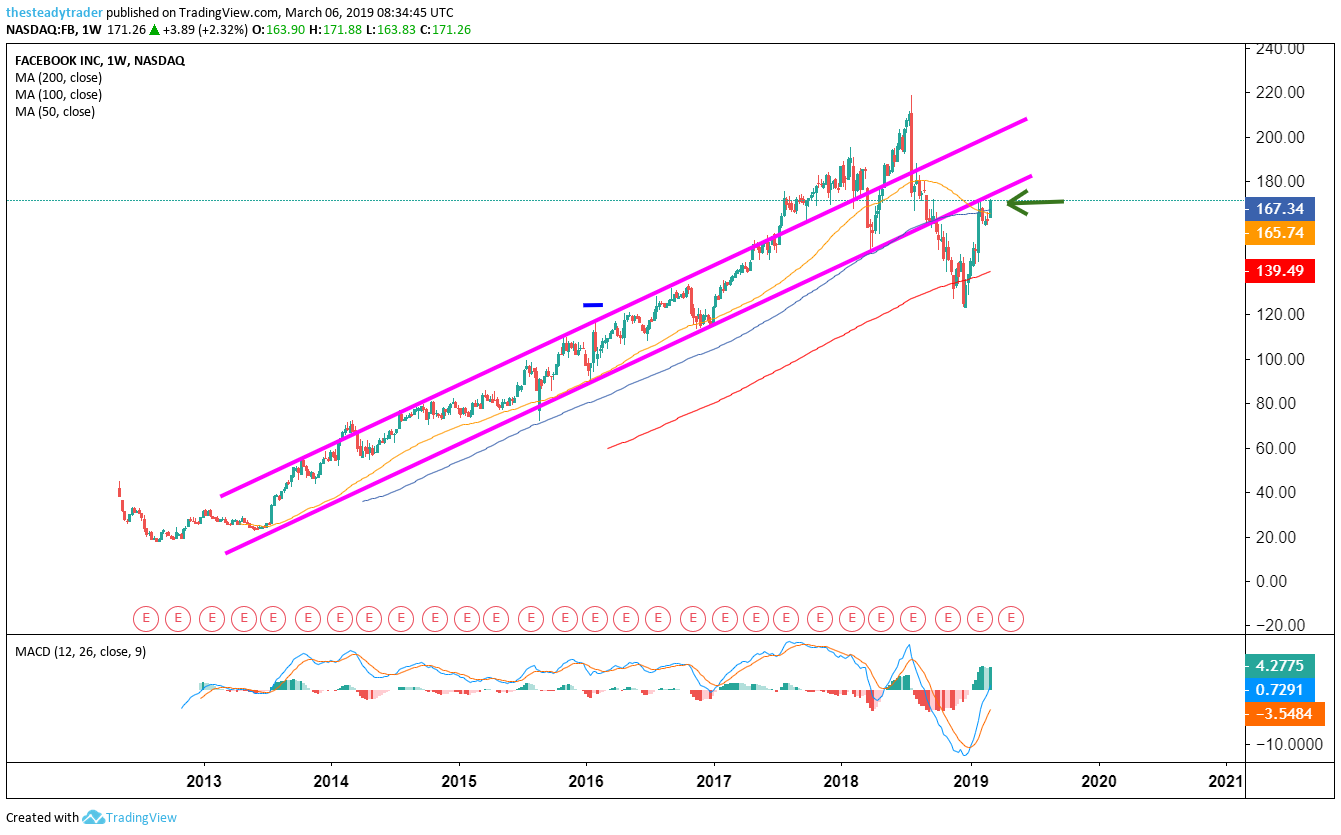
Moving averages legend: red – 200 week, blue – 100 week, yellow – 50 week
To wit, FB stock on its long-term weekly chart saw plenty of overshooting and undershooting moves in 2017 and 2018 of the well-defined up-trend (purple parallels). After overshooting the up-trend in 2018 and early 2018 the stock quickly began to mean-revert in the summer of 2018 and eventually overshot on the downside.
As a result of the recent sharp year-to-date rally FB stock has managed to rally back to lower end of said up-trending channel. Will this act as resistance? In my eye there is plenty of resistance here but from a momentum perspective in the near-term the stock could still squeeze higher. Remember, support and resistance on the charts is better drawn using a crayon rather than a pencil.
Click to Enlarge
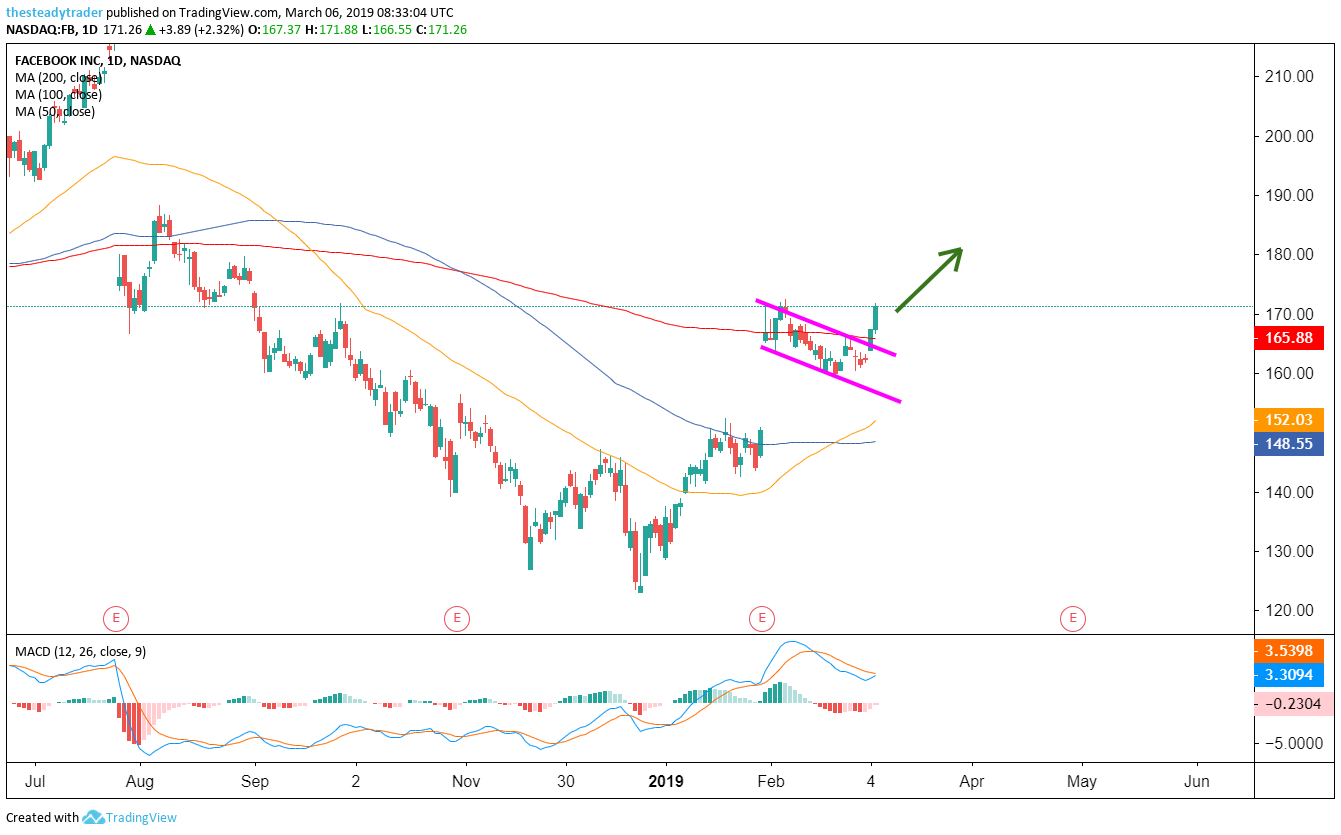
Moving averages legend: red – 200 day, blue – 100 day, yellow – 50 day
Zooming in on the nearer-term time frames on the daily chart we see that FB stock’s year-to-date rally has also brought it back up to around its red 200 day simple moving average. After an initial rally in the last few days of 2019 and into late January, FB stock gapped up and rallied following its latest earnings report.
Over the past few weeks the stock has consolidated in a constructive manner and now for the past two days has attempted a new leg higher, which has also pushed it back above the aforementioned 200 day moving average.
In fact, the most recent breakout in FB stock has followed a specific high probability candlestick pattern that I scan for each day. On Thursday I am holding a special webinar for Investorplace readers to teach this pattern in detail. Register HERE to join the free webinar.
The next upside profit target for FB stock here is $180 while any strong one-day bearish reversal would be a stop loss trigger.
The one candlestick pattern that will change your year. Free webinar. Register HERE.