In many ways, shares of semiconductor stocks have led the sharp year-to-date rally in stocks more broadly. One of the largest of them all, Intel (NYSE:INTC) is now higher by about 25% for the year and looking increasingly overbought as it heads into its next earnings report this coming week. A blow-off rally looks to be taking place here and this can provide an opportunity for active traders and investors.

Intel is set to report its next batch of earnings on April 25, i.e., one week from today and large-cap technology stocks, in general, are nearing their earnings reports.
What’s curious beyond the recent price action, which I will address on the below charts, is that INTC stock’s implied volatility has been rising over the past few weeks as the stock rallied another 12% or so. While a rise of a stock’s implied volatility a couple of weeks before earnings is no unfamiliar sight, implied volatility has been rising more sharply this time around, particularly if we consider the equally sharp rally in these stocks.
INTC Stock Charts
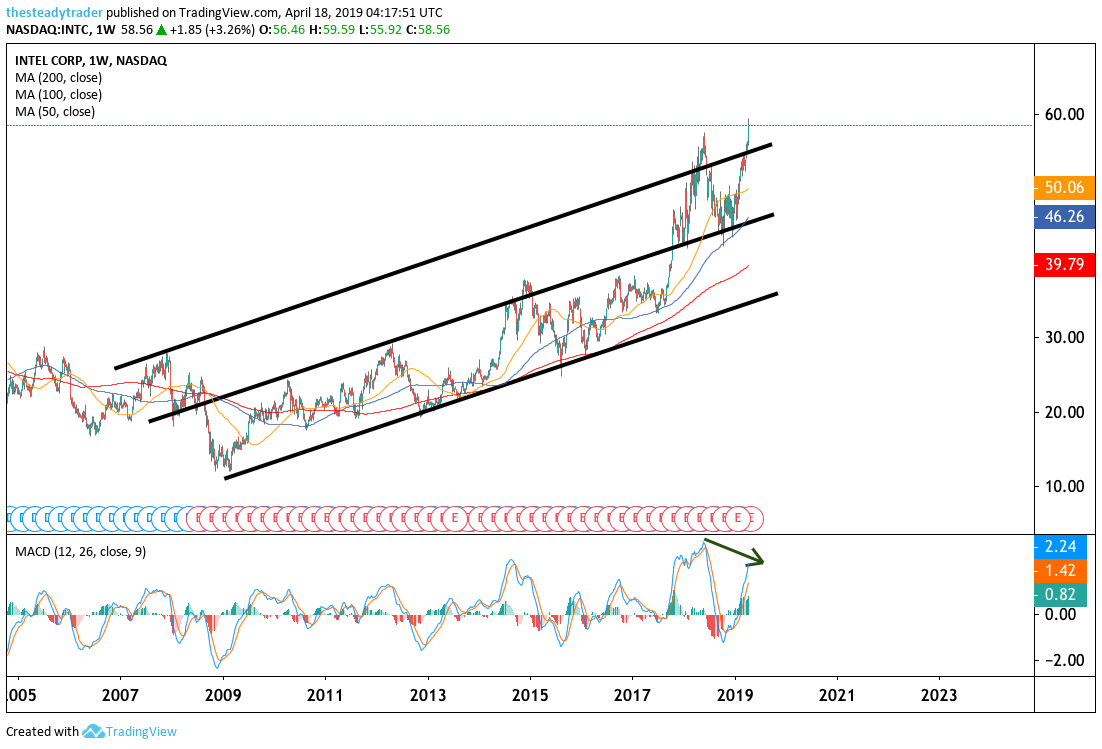
To gain some perspective on price let’s first take a look at the longer term, i.e., the multi-year chart with weekly increments. Here we see that INTC stock has just overshot its 2018 highs this week, but by doing so, it also broke back above the upper end of the longer-standing trading range, as marked by the black parallels.
Click to Enlarge
Moving averages legend: red – 200 week, blue – 100 week, yellow – 50 week
However, from a momentum perspective note that the weekly MACD indicator at the bottom of the chart is not yet confirming this breakout … so far. In fact, it is giving us negative divergence from price, i.e., signaling that this could be a breakout fake-out rally.
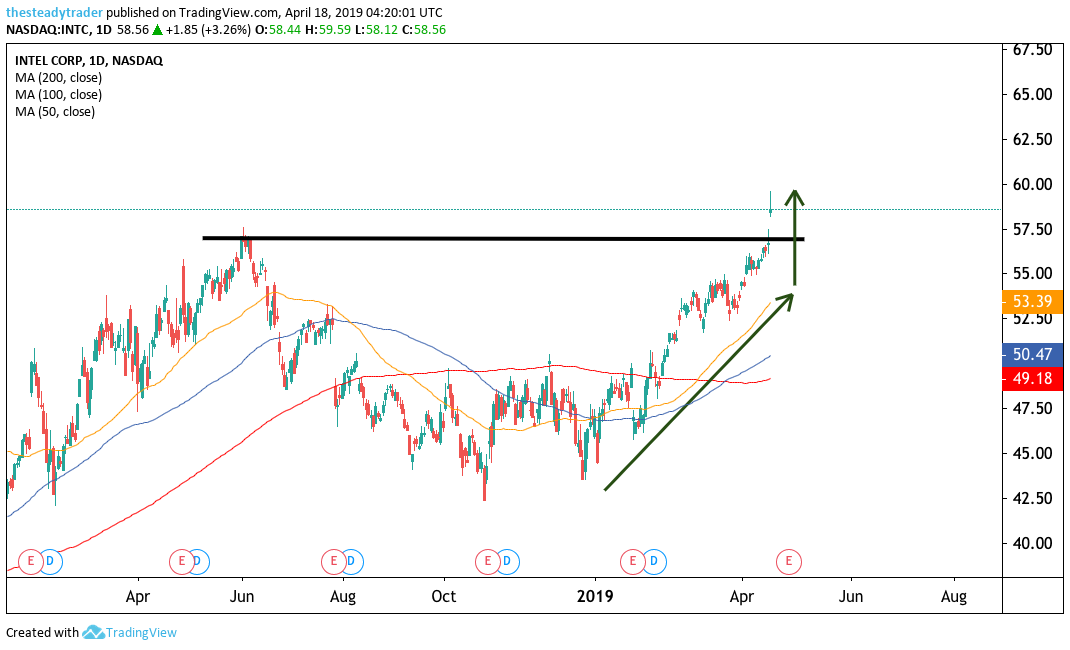
On the daily chart, we also see that over the past couple of weeks, INTC stock has steepened its already steep slope. And it’s showing signs of a parabolic move, which could result in a blow-off top and a bull trap.
Click to Enlarge
Moving averages legend: red – 200 day, blue – 100 day, yellow – 50 day
Intel stock is getting to a point now where it is far removed from its intermediate-term moving averages, historically speaking, and this will increasingly stretch the rubber band and lead to a snap-back — a mean-reversion move lower.
While I am no big fan of gambling on stocks ahead of their individual earnings reports, I do want to closely watch INTC stock this coming week after it reports earnings. My hunch is that we will see a classic candlestick pattern that flashes a sell signal following the earnings report. And I’m guessing that we’ll also see the stock mean-revert lower back into the mid to low $50’s.
Speaking of candlesticks, on Thursday, April 18, I am holding a special webinar to showcase the highest probability candlestick pattern that I know and practice. Click here to register.
Attend Serge Berger’s special webinar: The highest probability candlestick pattern, period. Click here to register.