Given Monday’s steep selloff, Tuesday’s bounce wasn’t a big surprise. It also was anything but convincing. The S&P 500’s gain of 0.8% and close of 2,834.41 was well off the day’s high of 2,852.42, leaving the matter of more selling in question.

General Electric (NYSE:GE) set the tone, and pace, gaining 4.6% mostly thanks to word that it had secured some important power plant business. Beyond Meat (NASDAQ:BYND) once again logged one of the day’s best gains though, up 14.6% as investors continue to fall in love with the idea of meatless meat.
Although they couldn’t drag the broad market into the red, there were some losers, led by Nissan Motor (OTCMKTS:NSANY). Shares of the carmaker fell 7.2% in response to another disappointing quarterly report, underscored by a poor outlook for this year.
Here, at the midpoint of the week, however, it’s the stock charts of Take-Two Interactive Software (NASDAQ:TTWO), CenterPoint Energy (NYSE:CNP) and Kimco Realty (NYSE:KIM) that are of the most interest. Here’s what to look for.
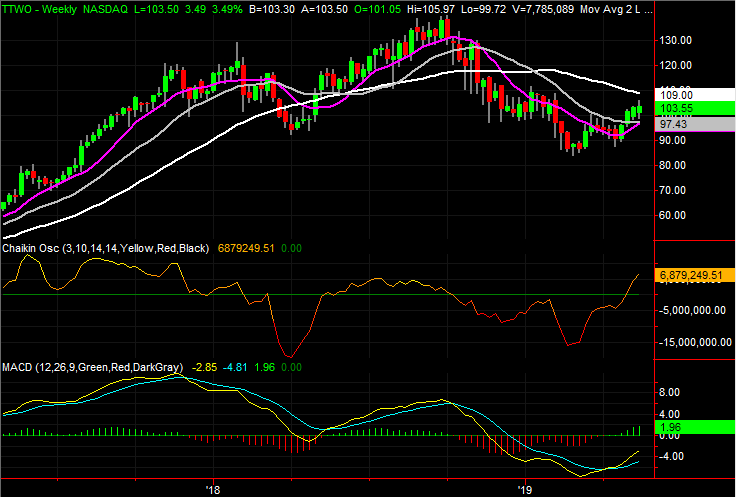
Take-Two Interactive Software (TTWO)
Sometimes, context is everything. It certainly has been for Take-Two Interactive Software shares during just the first two trading days of the week, particularly given that last quarter’s less-than-thrilling earnings were posted on Monday.
The stock fell, with the market, but didn’t fall anywhere near as much as it should have given the bearish environment and the fact that earnings fell. That, followed by yesterday’s oversized gains implies traders have been waiting for any reason to buy. Having tipped their hand, the breakout effort may be unstoppable now.
Click to Enlarge
- Notice that the thrust is shaping, and being shaped by, a diverging wedge pattern plotted in white dashed lines. Any defined framework like this is a bullish clue.
- Underscoring Tuesday’s gain is the volume surge behind it.
- Backing out to the weekly chart we can tell this uptrend has actually been developing for a while. The Chaikin line’s cross above zero last month and the MACD cross from March has only widened in the meantime.
- A cross above the recently developed ceiling of the diverging wedge could readily accelerate the rally effort from here.
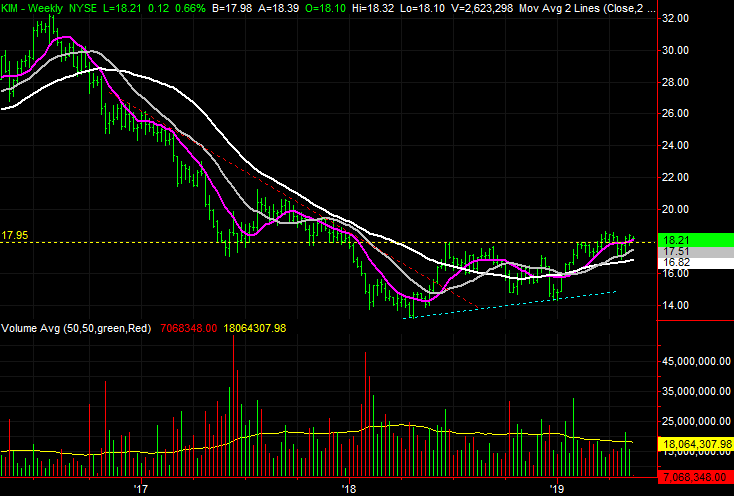
Kimco Realty (KIM)
Kimco Realty actually trailed the broad market’s sizeable rally on Tuesday. But, it also sidestepped the even-bigger meltdown on Monday and has found support at key levels of late while the overall market has been hit hard. More than that, it has found support at familiar floors. While there’s still one key hurdle left ahead, the undertow has been resiliently bullish. We’ll take the hints.
Above all else, KIM stock is back above the key level around $18, plotted in yellow on both stock charts. That line has been support and resistance in recent weeks.
Click to Enlarge
- Augmenting the support at $18 is more recent support provided by the purple 50-day moving average line and the blue 20-day moving average. That support is highlighted, as is last month’s similar support from the gray 100-day moving average line.
- It takes the longer-term view of the weekly chart to fully appreciate how well the new uptrend is forming now that the downtrend of 2017 has been snapped and 2018’s stagnation is in the rearview mirror. We’ve now seen a higher high and higher low.
- A break above March’s high near $18.80 could wind up being a bullish catalyst with lots of room left to recover.
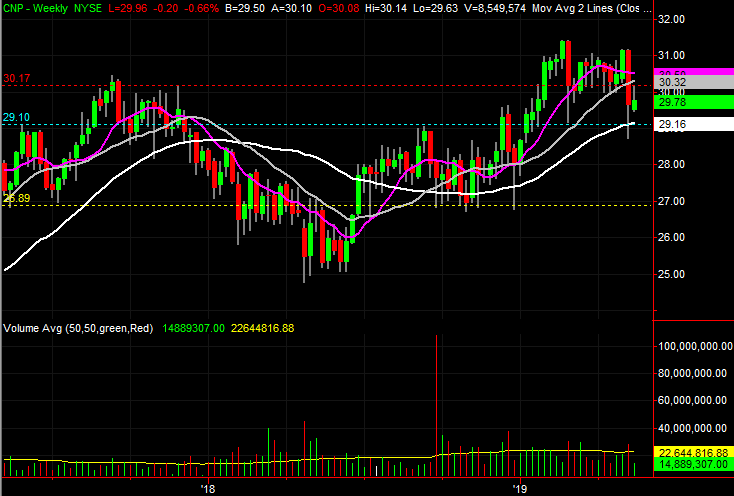
CenterPoint Energy (CNP)
CenterPoint Energy is a name that has been off and on the radar for several weeks now. It had slipped off in April, when the break above a key ceiling early this year faded into a period of sideways movement. The past few days have been volatile enough to put it back in focus. But this focus comes with no clarity as to which direction it really wants to go next. The good news is, the recent action has defined where the key lines in the sand are.
Click to Enlarge
- Friday’s reversal was prodded by a new encounter with the white 200-day moving average line, though the horizontal line around $29 — plotted in blue on both stock charts — had also been a key support and resistance level before being revisited.
- Although the reversal was impressive, it was also halted abruptly at the gray 100-day moving average line on Monday. The stock rolled over on Tuesday, falling against a bigger bullish tide.
- Notice that the two bearish days sandwiching Friday’s and Monday’s gains were both higher volume days, suggesting there are more buyers than sellers.
- If the floor around $29 snaps, the next most likely floor is around $27, where shares found support several times in the last few months of last year.
As of this writing, James Brumley did not hold a position in any of the aforementioned securities. You can learn more about James at his site, jamesbrumley.com, or follow him on Twitter, at @jbrumley.