Technical analysis has a bad reputation and I can totally understand why. Most of the technical research that I see ranges from just plain bad to downright ludicrous. As a veteran technical analyst, sometimes I just want to bow my head in shame when I see some of this garbage. However, there is a lesson here to be learned among marijuana stocks, particularly Medicine Man Technologies (OTCMKTS:MDCL).

Most technical analysts study the markets and look for patterns without actually knowing just what it is they are supposed to mean. In addition, things such as Harmonic charts, Elliot wave and Gann theory are like UFOs and Bigfoot. They are fun to talk about, but they are not real. In my more than twenty years as a hedge fund trader, I can honestly tell you that not once did I ever hear successful institutional portfolio managers or traders mention them.
However, there is validity to some traditional technical analysis techniques if used and applied correctly. Things such as momentum oscillators, support and demand levels, and reversal patterns are very valid if the user actually understands what they are. Successful portfolio managers and traders do talk about these techniques.
When used and understood correctly, technical patterns should be an illustration of the supply and demand dynamics that are occurring in a market.
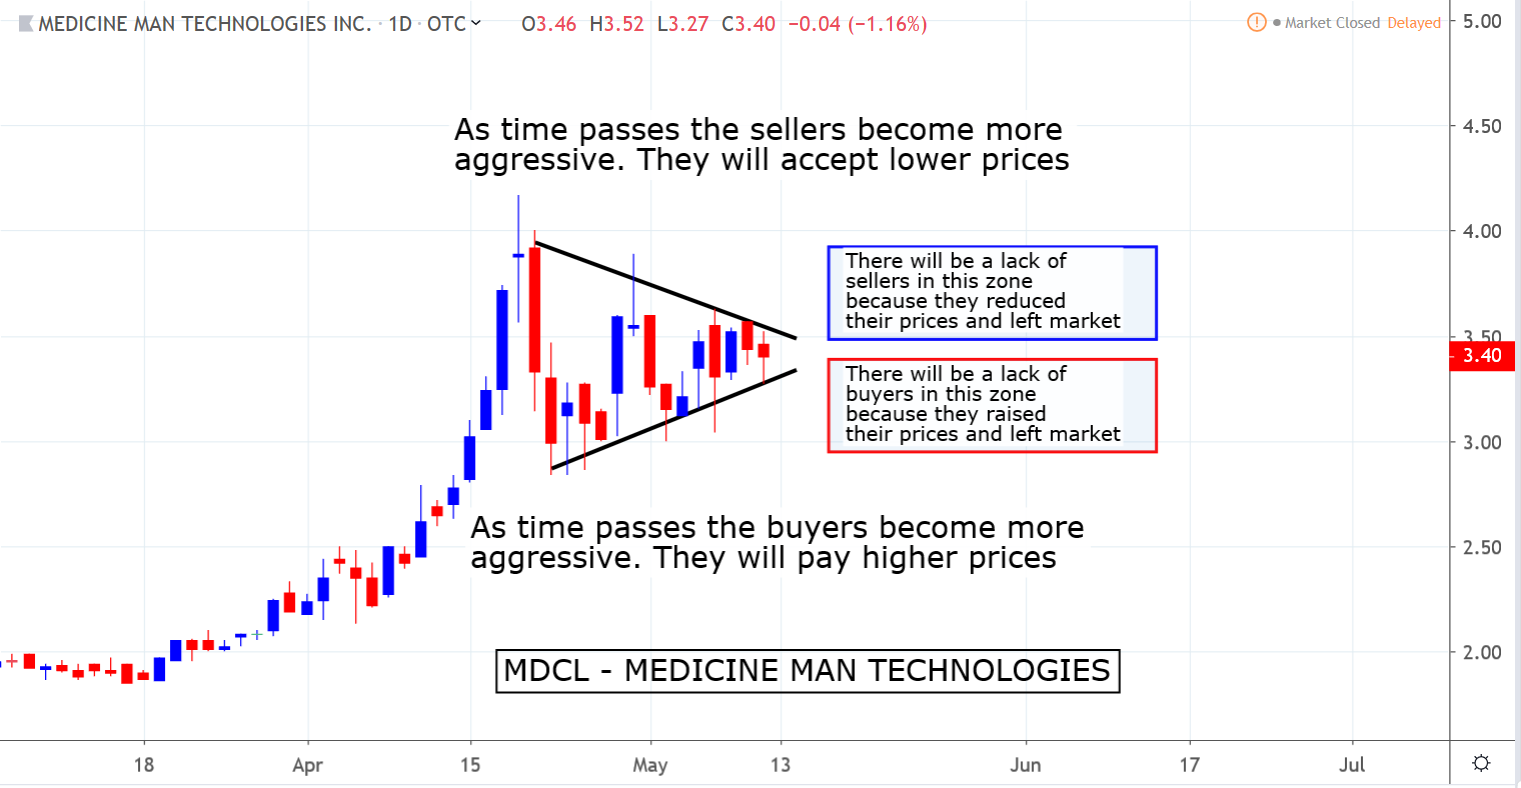
Click to Enlarge Let’s take a look at this perfect symmetrical triangle pattern that has formed in MDCL, What exactly does this mean?
This pattern tells me that MDCL is going to make a significant move either upward or downward in the near future. Here is why …
The chart illustrates that as time progressed the sellers became more aggressive. This means that they were willing to accept lower prices. In addition, as time progressed the buyers also became more aggressive. That means they were willing to pay higher prices. These dynamics are what creates the triangle pattern on the chart.
You can see that in mid-April MDCL was trading between $3 and $4. Then, as time passed, the range got smaller because the buyers and sellers both become more aggressive. By early May the range had fallen $3.30 to $3.50 and the close on Friday was at $3.40.
Because of this, there will now be a lack of supply between current levels and $4. This is because the sellers who would typically be in this range are no longer there. They reduced their prices and sold their stock. In addition, there will now be a lack of demand between current levels and $3. That is because the buyers who would typically be at these levels paid higher prices. They completed their orders and are no longer in the market.
Now we have a situation where there is little sell interest between current levels and $4 and little buy interest between current levels and $3. These dynamics set up a situation where the stock could make a dramatic mover either up or down.
For example, suppose you wanted to buy 1,000 shares. If there was plenty of supply in the market there may be 500 shares offered at $3.45 and 500 shares offered at $3.50. You would buy your 1,000 shares at an average price of $3.475.
Now suppose that there is a lack of supply in the market. There may be 500 shares offered at $3.45, but there may not be any more shares offered until the price gets to much higher levels. If the next lowest offer of 500 shares was at $3.95 and you bought them your average price would be $3.70. This is 10% higher then the price would be if there was more supply around current levels!
Of course, the same dynamics apply to selling as well If there is sufficient buy interest at $3.35 a seller could sell their shares at that price. If there is no buy interest until the price gets down to the $3 level, then the seller would have no choice but to sell it for $3. This is more than 10% lower then it would be if there was more demand!
This example illustrates how a lack of supply or demand in the markets can cause them to move dramatically. The classic technical analysis literature says that symmetrical triangle patterns are typically (about 2/3rds of the time) continuation patterns. This means that the breakout will be to the upside as the longer range uptrend continues.
My goal here is not to give a trade recommendation. My intention is to show how there is some validity to some technical analysis techniques. Stay away from ridiculous nonsense like Gann theory and Elliot waves. Use common sense and try to understand how certain patterns or formations illustrate supply and demand dynamics. I promise that it will help your trading.
As of this writing, Mark Putrino did not hold a position in any of the aforementioned securities.