Technical analysis has a bad reputation and I can certainly understand why. Most of the technical research that I see ranges from just plain bad to downright ludicrous. As a veteran technical analyst, sometimes I just want to bow my head in shame when I see some of this garbage. However, there is a legitimate technical analysis lesson to be learned here in the stock of Walt Disney (NYSE:DIS).

Most technical analysts study the markets and look for patterns without actually knowing just what it is they are supposed to mean. In addition, things such as Harmonic charts, Elliot wave and Gann theory are like UFOs and Bigfoot. They are fun to talk about but they are not real. In my more than twenty years as a hedge fund trader, I can honestly tell you that not once did I ever hear successful traders mention them.
However, there is validity to some traditional technical analysis techniques if used and applied correctly. Things such as momentum oscillators, support and demand levels, and reversal patterns are very valid if the user actually understands what they are. Successful traders do care about these techniques.
When used and understood correctly, technical patterns should be an illustration of the supply and demand dynamics that are occurring in a market.
When stocks make gap formations they tend to refill. A gap is a dramatic move that ‘skips’ price. For example, suppose that over the course of a few weeks the price of a stock trends from $5 to $10. Then one day when the market is closed, they announce earnings that beat estimates and the stock opens at $15 and trends higher to $20 over the following few weeks. On a chart, the range between $10 and $15 would show up as a gap.
To understand why is gaps refill, one must understand how support levels develop. Suppose a stock spends a few weeks trading at the $20 level. There are those who bought it, those who sold it. There are also those want to buy it but for some reason they do not.
Now suppose the stock trades up to $21. Those who bought it at $20 are mad at themselves for not buying more and tell themselves that if the stock gets back to $20, they will add to their position.
The short-sellers who sold it at $20 now have a loss. They tell themselves that if it gets back to $20, they will cover their shorts and breakeven. The people who stayed on the sidelines are upset that they missed it and themselves that is it gets back to $20 then they will buy it. Professional traders who see that a support level is developing and they will consider buying it as $20 as well. These four interested parties will create a support level at $20.
Now this is the important thing to understand. The more time a stock trades at a certain level, the more vested interest, in terms of buy and sell demand, will exist at them.
If a stock gaps over a few points, there was no trading at those levels. The vested interest would not develop to the degree that it would if significant volume traded at those levels.
When the stock trades back into the gap there will be little sell and buy interest so the stock could make a large move in a short period of time. A large buy or sell order could dramatically move the price of the stock. This is why gaps tend to refill.
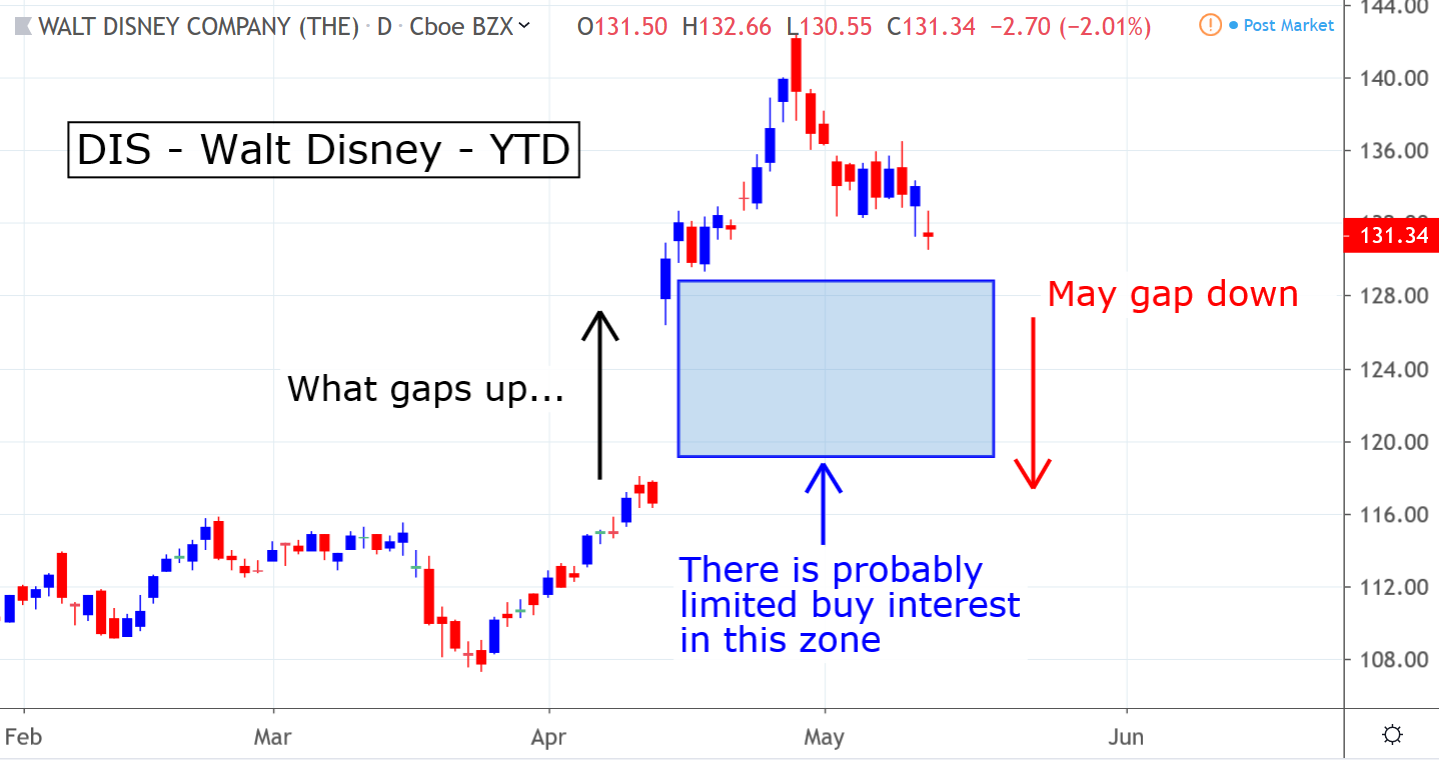
Click to Enlarge That could be the case here with DIS. On April 12 it gapped up from $117 to $130. This was the result of the company announcing the price and launch date. If you own this one, keep a close eye on this dynamic. If it trades below the $130 level, there is a chance that it could make a dramatic move right back down to levels around $117.
My goal here is not to give a trade recommendation. My intention is to show how there is some validity to some of the traditional technical analysis techniques. Use common sense and try to understand how certain patterns or formations illustrate supply and demand dynamics.
I promise that it will help your trading.
As of this writing, Mark Putrino did not hold a position in any of the aforementioned securities.