Shares of Amazon (NASDAQ:AMZN) have certainly been struggling over the past year. AMZN stock is now down 12% after making an all-time high near $2,050 last September. Certainly some of the sell-off was warranted given that Amazon stock briefly breached the trillion dollar market cap level that had previously torpedoed the likes of Apple (NASDAQ:AAPL) as well.
Since the beginning of August, Amazon stock has been mired in a trading range bounded by $1,750 to the downside and $1,875 to the upside. This type of price action doesn’t go on forever.
Look for a breakdown or a breakout some time over the coming month in AMZN stock.
AMZN Stock Chart
AMZN stock continues to consolidate in an ever-narrowing range following a disappointing earnings report in late July. Amazon has been trapped between the 100-day moving average to the upside and the 200-day moving average to the downside. Five-day RSI has been bouncing back and forth between almost overbought to almost oversold. MACD is now back once again to neutral. Momentum continues to hug the zero line while Bollinger Percent B is also mired in no man’s land.
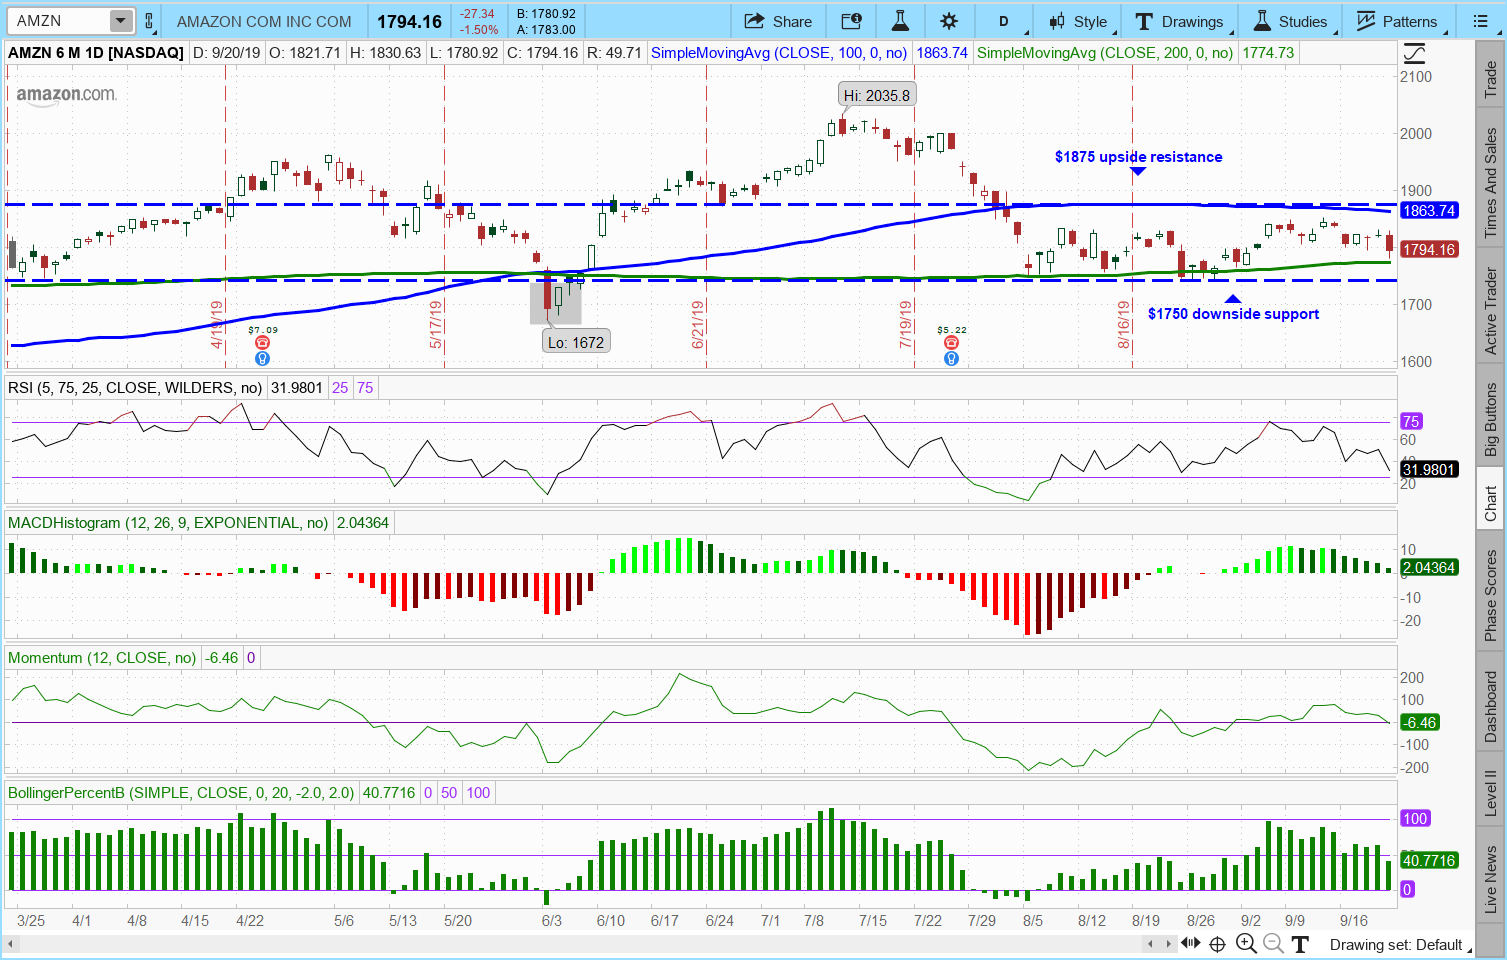
This sideways price action can last only so long. At some point AMZN stock is due to break out of this funk and make a big move. Given that Amazon has been coiling ever-tighter for nearly two months now, the breakout will likely be sooner than later. This is especially true since earnings are due late October.
Over the past six quarters, the month preceding the earnings release has seen an average move of over 7.5% for AMZN stock, with the smallest move still being 5.1%. This average move of 7.5% would imply a roughly $130 point move for Amazon over the coming 30 days-well past the current support and resistance levels of $1,750 and $1,875.
Implied volatility (IV) is only at the 11th percentile. This means option prices are getting comparatively very cheap. AMZN bulls and bears alike would be well-served to position for a pop or drop by going long a defined risk option spread. These spreads can provide significant profit potential — with defined risk — if Amazon stock performs anywhere close to what it has done over the past six quarters.
Bullish Trade for an Upside Breakout
Buy AMZN Oct $1,875/$1,880 call spread for $1.50
Maximum risk on the trade is $150 per spread with maximum gain of $350 per spread. Potential return on risk is 233% if AMZN stock closes above $1,880 at October expiration. The long call strike is structured right at the upside resistance level of $1,875 to play for a breakout. The $1,875 area is only 4.4% above the closing price of AMZN stock.
Bearish Trade for a Downside Breakdown
Buy AMZN Oct $1,750/$1,745 put spread for $1.75
Maximum risk on the trade is $175 per spread with maximum gain of $325 per spread. Potential return on risk is 186% if AMZN closes below $1,745 at October expiration. The long put strike is set at the downside support area of $1750 to play for a breakdown. The $1,750 level is only 2.45% below the closing price of AMZN stock.
As of this writing, Tim Biggam did not hold a position in any of the aforementioned securities. Anyone interested in finding out more about option-based strategies or for a free trial of the Delta Desk Research Report can email Tim at timbiggam@gmail.com.