Despite wild trading, U.S. stocks managed to eke out a gain last week. But it doesn’t seem like that gain is going to last.

Futures contracts on the S&P 500 tripped circuit-breakers overnight after falling 5%. The 10-year Treasury bond is yielding an almost unfathomable 0.5%. Panic clearly dominates the markets at the moment.
In the context of what likely will be another high-volatility week, Monday’s big stock charts focus on three of the market’s highest-quality, most widely-owned names. Perhaps unsurprisingly, two of these stocks have held up reasonably well amid the market’s gyrations. Another, however, has plunged toward support.
The issue for the market as a whole is simple: if even the best names are falling, there’s basically nowhere to hide. The good news, for now, is that these stock charts do look reasonably bullish. The bad news is that overnight trading suggests that investors don’t particularly care right now.
AT&T (T)
Given broader trading, the performance of AT&T (NYSE:T) stock hasn’t been that bad. But the first of Monday’s big stock charts does show some sign of concern:
- Save for a quickly reversed plunge late last month, T stock has seen support hold repeatedly above $36 going back all the way to September. Whether it’s the dividend yield, the modest lack of exposure to macro factors, or valuation, investors have bought basically every dip in T stock so far.
- That said, there’s some pressure building on that support. Lower highs going back to November establish a bearish descending triangle pattern. Shares failed to clear the 50-day moving average last week, another sign of potential resistance. Buyers have come in below $37. Sellers, particularly this year, have done the same below $39.
- In this market, that seems like a problem, given that sellers quite obviously are driving price action. There comes a point in any bear market where even high-quality defensive names get routed. T stock hasn’t been immune to past sell-offs, either: it fell 40% in a matter of months in 2008 and 15% in the fourth quarter of 2018. The chart does suggest AT&T stock at least has a chance of rolling over as long as wider selling continues.
JPMorgan Chase (JPM)
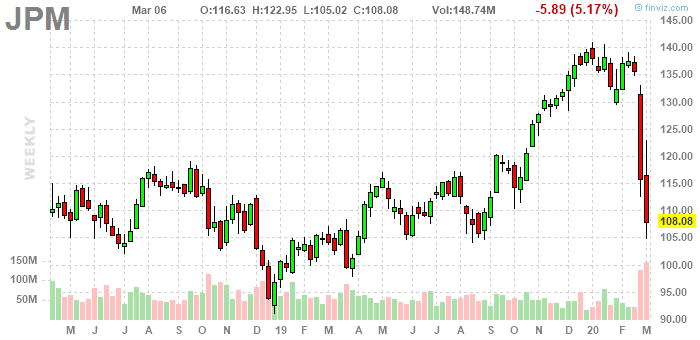
The 5.2% decline in shares of JPMorgan Chase (NYSE:JPM) hid one piece of potentially good news. But the modest good news in the second of our big stock charts likely won’t last long:
-
Click to EnlargeSource: Provided by FinvizJPM stock actually opened the session Friday down 7.7%, but managed to claw back over one-third of that loss. As the chart shows, that opening low was right at support that held last year. Looking to the weekly chart, that level drew in buyers back in 2018 as well.
- The problem is that Monday already looks like it will be a different market and the news already looks worse for JPMorgan Chase. The odds of a rate cut by the Federal Reserve are climbing steadily even after last week’s 50 basis point reduction. Those lower rates will further pressure net interest margins and earnings.
- To be sure, JPM stock looks too cheap already, at almost exactly 10x current consensus earnings per share estimates for this year. A 3.3% dividend yield looks attractive as well. But if earnings are declining going forward — and potentially for several years if a recession hits — “too cheap” may not be good enough. Indeed, rival Bank of America (NYSE:BAC) saw its stock fall through support on Friday.
- That fact makes JPMorgan Chase stock an interesting test on Monday. If the stock can hold up to even some extent, that’s undoubtedly good news for the rest of the market, as it signals that investors are taking the long view in looking for value. That seems like an awful big ‘if’ at the moment, however.
Philip Morris International (PM)
The third of Monday’s big stock charts does make some sense. Philip Morris International (NYSE:PM) doesn’t have a tremendous amount of correlation to macroeconomic factors. It remains to be seen whether investors will remember that fact — and whether reasonably solid trading will hold:
- PM’s chart actually looks reasonably bullish. Shares have established an ascending triangle pattern, suggesting momentum toward a break through resistance around $89. The stock has bounced off its 200-day moving average on more than once occasion (excluding a brief late February plunge). Resistance has been stiff, and it’s probably too early to bet on a massive breakout above $90, but in the context of this market the chart at least looks positive.
- Fundamentally there’s an intriguing case. Philip Morris’s overseas markets are expected to hold up better than those of domestic counterpart (and former parent) Altria (NYSE:MO). Philip Morris earnings per share still are growing high-single-digits, excluding the impact of currency. A 5.7% dividend yield is attractive in any market, but particularly in an environment where the 30-year Treasury bond now yields less than 1%. If value stocks were to return to favor — something which still hasn’t happened in this sell-off — PM stock would seem a good place to start.
- That said, investors can’t assume broad market trading won’t impact Philip Morris stock. Like AT&T stock, PM shares plunged during the financial crisis. Quarantines and recessions overseas could hit demand. PM might be less risky than most stocks in this market. That doesn’t necessarily mean it’s safe.
Vince Martin has covered the financial industry for close to a decade for InvestorPlace.com and other outlets. He has no positions in any securities mentioned.