The Nasdaq is down more than 10% from its highs as volatility continues to throttle the stock market. FuelCell Energy (NASDAQ:FCEL) hasn’t been able to escape the market’s wrath either, with FCEL stock down about 30% from its highs just a few weeks ago.

Surprisingly though, the charts don’t look bearish. In fact, they actually look rather good.
I don’t remember the last time I looked at a stock that was down 33% from its highs in such a short period of time and thought it looked appealing. That said, while the charts tilt bullish, there are caveats.
First, this stock has an incredibly large trading range, with a 52-week range spanning from 13 cents to $5.88. Second, while it averages more than 10 million shares traded per day, it has a market cap of less than $500 million. For many, the wide range and low market cap make it a no-touch, and I can’t blame them.
For others though, FCEL stock is a speculative play. Granted, it may not be the best time for a spec stock, but the charts are the focus right now. Let’s have a look.
Trading FCEL Stock
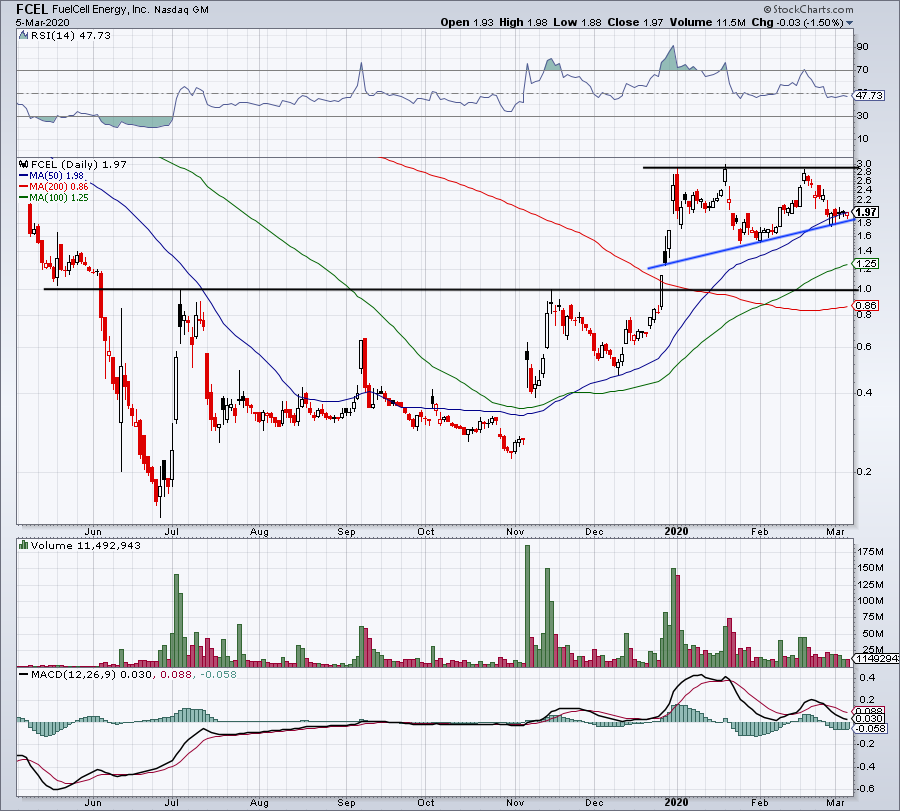
Above is a daily look at FuelCell stock, while a weekly chart is below. They show similar setups, albeit, on different timeframes.
In the one above, traders will notice resistance coming into play between $2.80 and $3 per share. So far, each dip from this resistance zone has been shallower than the last. While not typically done with such a wide range, this is known as an ascending triangle.
That’s a bullish technical pattern where rising uptrend support (blue line) squeezes a stock against a static level of resistance (black line).
It helps that the 50-day moving average also comes into play near uptrend support, although FCEL stock is showing some signs of struggle to stay above this mark. In any regard, should shares remain above this level, it puts a move back over $2 on the table, and as bulls hope, technically leaves a retest of $3 on the table.
Ultimately, the goal is to see resistance give way, and FuelCell stock trigger a breakout over the $3 mark. Should support fail though, it puts the 100-day moving average on the table, followed by the $1 mark.
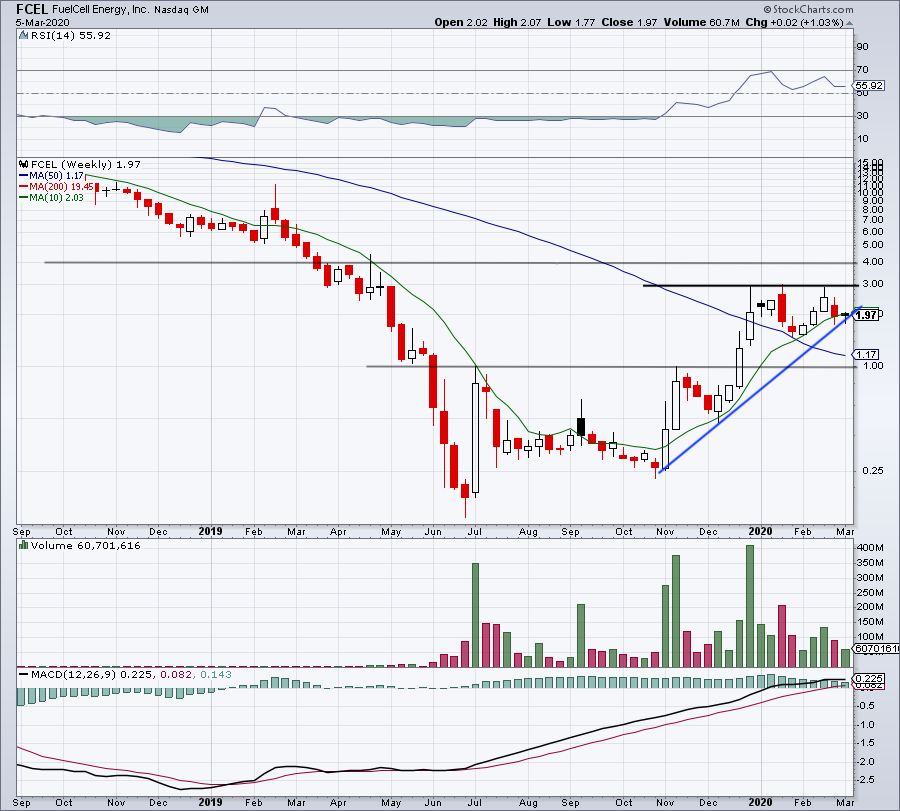
The weekly chart shows a similar pattern. That is, a rising trend being stymied by $3 resistance. Should it give way, it could trigger a move to $4, which would represent a double from current levels.
Currently, FCEL stock continues to maintain above the 10-week moving average. However, it’s struggling to hold its longer-term uptrend support mark. If it begins to break down from current levels, it could trigger a move lower, with the $1 to $1.25 area being the next support zone.
Where Do I Stand?
Technically speaking, the charts don’t line up terribly for FuelCell stock. They even tilt bullish and if the bull case were to pan out, major upside could be ahead. But we’re not dealing with a normal environment here.
The indices are thrashing about in a wild manner, while the Volatility Index (VIX) remains quite elevated. That doesn’t bode well for speculative positions. In a normal environment, I would consider FCEL stock a risky play, but in this environment, I consider it even more so.
When time are tough, that’s when investors should do one of three things (and preferably a combination of them):
- Assess the market condition and take less risk.
- Lean on companies with the strongest businesses – their moat and financials.
- Have an above-average amount of cash on hand to deploy in favorable situations.
Now, FCEL stock may just be one of those opportunities. However, it falls on the riskier side of potential investments and does not fall in the category of high-quality assets. The latter consists of companies like blue-chip dividend stocks and cash-hoard giants like Microsoft (NASDAQ:MSFT) or Alphabet (NASDAQ:GOOGL, NASDAQ:GOOG).
FuelCell is neither profitable nor free cash flow positive. It has $90 million in long-term debt, which is roughly 20% of its market cap. Further, while current assets and total assets top current liabilities and total liabilities, respectively, its overlap is not overwhelmingly convincing.
So here’s the bottom line: If you are compelled by a long position in FuelCell, then keep an eye on the technicals and use extreme discipline. If shares break down, notable downside could be on the way. For everyone else, FCEL stock is likely too risky a trade right now.
Bret Kenwell is the manager and author of Future Blue Chips and is on Twitter @BretKenwell. As of this writing, Bret Kenwell is long GOOGL.