Having has written about Marathon Oil (NYSE:MRO) multiple times in recent months, I must say its narrative hasn’t changed one bit. Nor has its price action. The trading range is proving stickier than syrup and is now moving into its fifth month. While the MRO stock stalemate is certainly a buzzkill for directional trades, the options market provides a few strategies to consider.

After analyzing Marathon’s performance, both on an absolute and relative basis, we’ll explore which derivatives trades make the most sense here.
Neutral – Absolutely & Relatively
Any discussion of the absolute performance of an asset considers its price movements in a vacuum. By itself, the MRO stock chart is about as unexciting as it gets. It participated in the grand stock recovery off the March lows, at least during the early innings. But while the S&P 500 index has continued climbing — up 15.3% since April 30 — ultimately to record highs, Marathon Oil has lost its way, off 2.1% in the same period.
It’s drifting, aimlessly, in search of a catalyst to renew buying interest in energy stocks. To be fair, this isn’t a Marathon problem as much it is an energy sector problem — more on that in a moment.
The price action is easy to read here. Pivot relationships carve out a series of equal highs and lows. We know now the June surge was a ruse fueled by false hopes. The return back to the range was swift, and we’ve seen nothing but sideways slithering since. The 20-day and 50-day moving averages echo the neutrality and aren’t providing any significance at this stage.
This week’s whack has returned Marathon to the south end of its range, giving bears the upper hand for now.
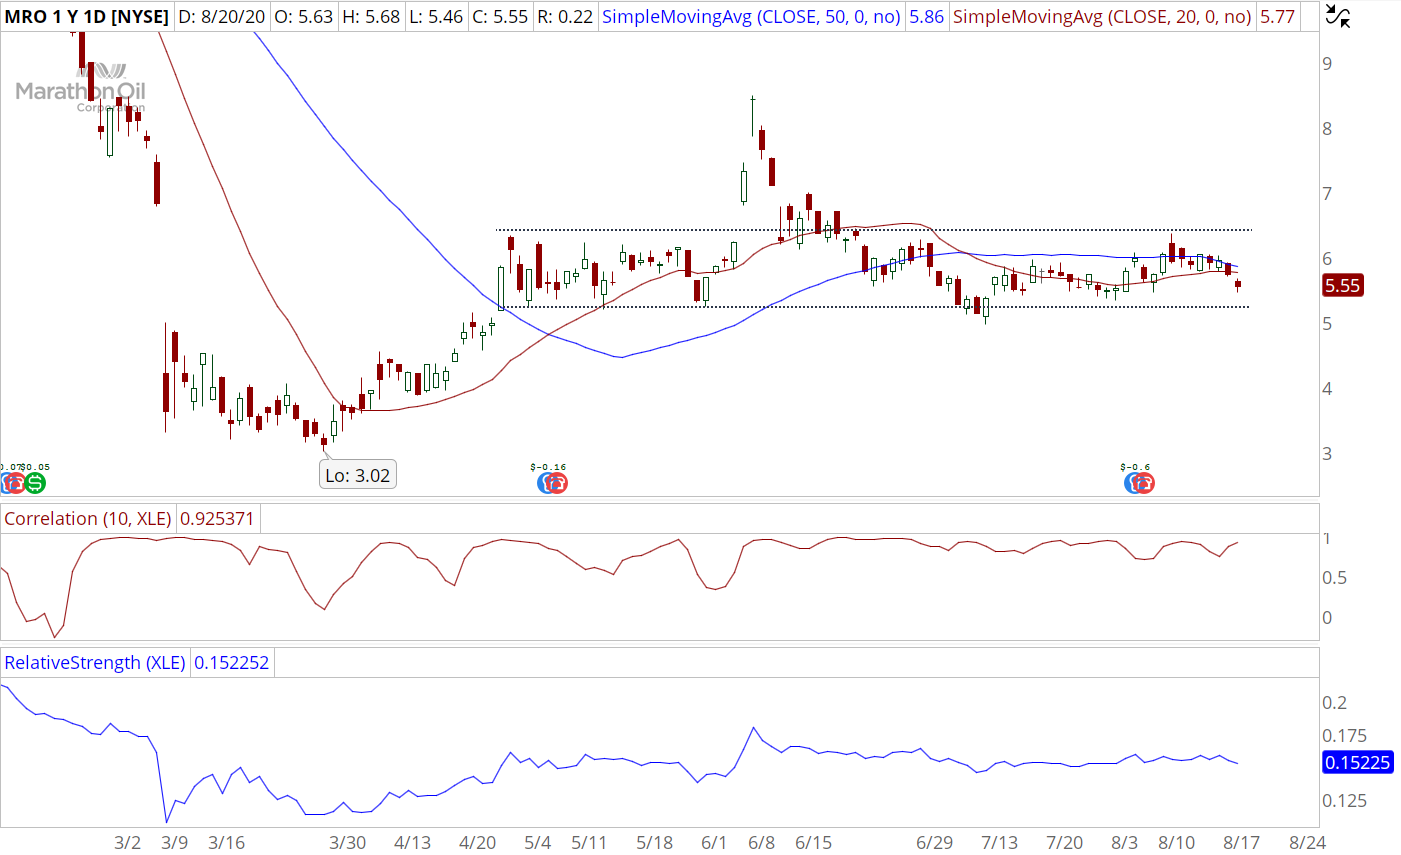
Click to Enlarge
For further insight into Marathon’s movements, let’s compare its price action to that of the Energy Sector SPDR Fund (NYSEARCA:
XLE). The current 10-day correlation is an extremely high 0.92. That means they’ve been moving in lockstep. But just because Marathon is running in the same direction as the energy sector doesn’t necessarily mean it’s moving at the same magnitude. For that measurement, we need the relative strength indicator.
This study is plotted as a line that rises when MRO stock is outperforming the energy sector and falls when it is underperforming. As shown below, the line has been virtually flat since May, suggesting that MRO is simply mirroring XLE. It’s not so much that Marathon has become unmoored from its underlying fundamentals; it’s that market participants view its fate no differently than the entire sector. As goes one, so goes the other.
For now, at least.
MRO Stock Options Trade
My suggestion for stock traders is to steer clear. The dead-money drift has stolen any edge for directional trades. At $5.50, the stock is too cheap to consider for options spreads, so we’re left with either naked puts or covered calls. I’d rather have a bullish leaning cash flow trade due to the stock’s low price.
Of the two, the naked put is more attractive to me. In timing the entry, I suggest waiting for a break of a previous day’s high. If Marathon keeps pulling back, you’ll get a better price for the put.
The Trade: Sell the Sep $5 put option. It’s currently trading for 23 cents, but the price may change by the time the stock triggers.
The max gain is the premium received.
For a free trial to the best trading community on the planet and Tyler’s current home, click here! At the time of this writing, Tyler didn’t hold positions in any of the aforementioned securities.