
Tech stocks have been on a roller coaster lately. While some continued to chug to new all-time highs, others suffered a brutal decline amid a nasty bear market. However, many names have emerged with stronger chart setups as a result.
Many people only prefer technical analysis or fundamental analysis. However, a blend of the two usually works the best.
Fundamental analysis may struggle with tech stocks when it comes to the valuation. While the valuations can be high, I like to look for high-quality businesses and substitute technical analysis in. A strong business plus strong technicals puts the odds in investors’ favor, even when the valuation can be a bit tough to swallow.
With that said, let’s look at seven tech stocks with the best charts. (These seven stocks also happen to be great businesses).
- Amazon (NASDAQ:AMZN)
- CrowdStrike (NASDAQ:CRWD)
- DocuSign (NASDAQ:DOCU)
- Twilio (NYSE:TWLO)
- Roku (NASDAQ:ROKU)
- Nvidia (NASDAQ:NVDA)
- Shopify (NYSE:SHOP)
Some investors think technical analysis is just a bunch of arbitrary lines and meaningless explanations drawn to justify a certain bias. That certainly can be true. When used correctly though, I find that technical analysis is simply a visual representation of supply and demand, as well as sentiment. It’s why I find it so helpful.
Tech Stocks With the Best Charts Amazon (AMZN)
Click to Enlarge
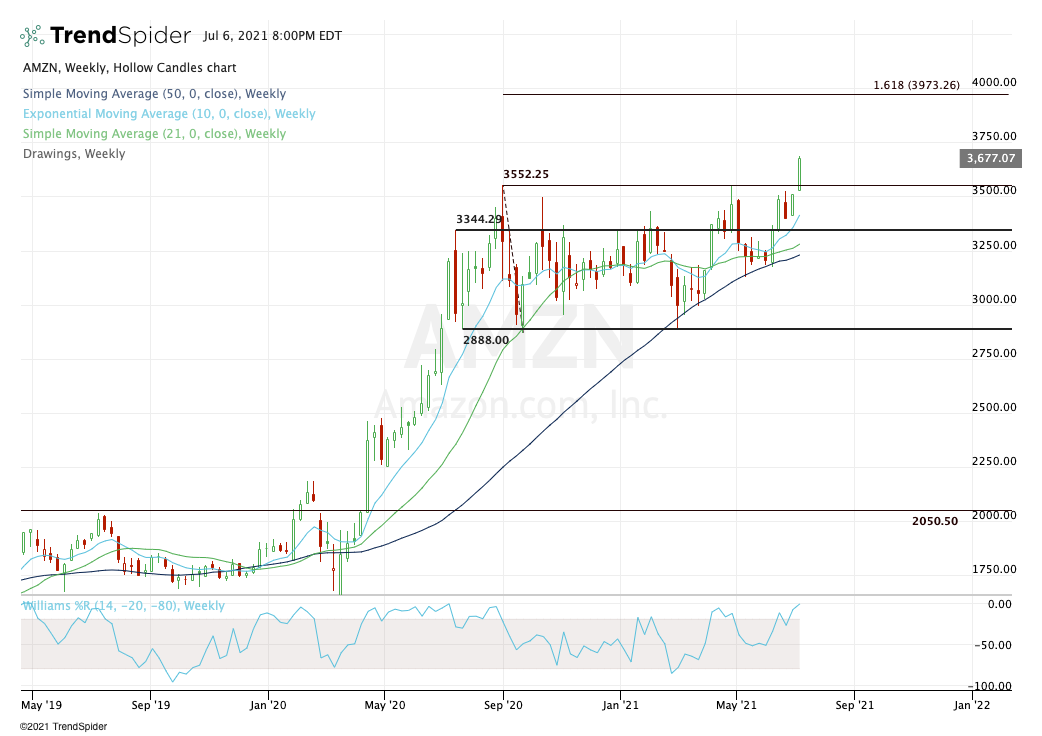
The chart for Amazon showcases one of the cleanest breakouts I have seen in a while. For those that enjoy reading InvestorPlace’s Top Stock Trades column, you may notice that I have highlighted this name quite a bit in recent weeks.
That’s because Amazon has been building out a base for almost a year now. With almost zero urgency, this stock has been trading sideways for nearly 12 months. Despite incredible quarterly reports, news of CEO Jeff Bezos stepping down and lack of a stock split has likely kept this name weighted down.
Until now.
Bezos has stepped aside and with a new CEO at the reins, the stock is catching fire. Perhaps it will be a failed breakout but for all intents and purposes, we have to treat this like the real deal.
Over $3,345 was the start. That set the tone and technically put Amazon over range resistance. However, $3,550 was the really tricky hurdle. The stock had failed at this level twice before.
Blasting through it now, bulls need to see pullbacks to the 10-week moving average (and the 10-day and 21-day moving averages) act as support. They also need to see dips to the $3,550 level hold as support. This would be quite bullish and set the stock up for more new highs.
On the upside, $3,750 is in play at this point, followed by a potentially larger push to the 161.8% retracement just under $4,000.
CrowdStrike (CRWD)
Click to Enlarge
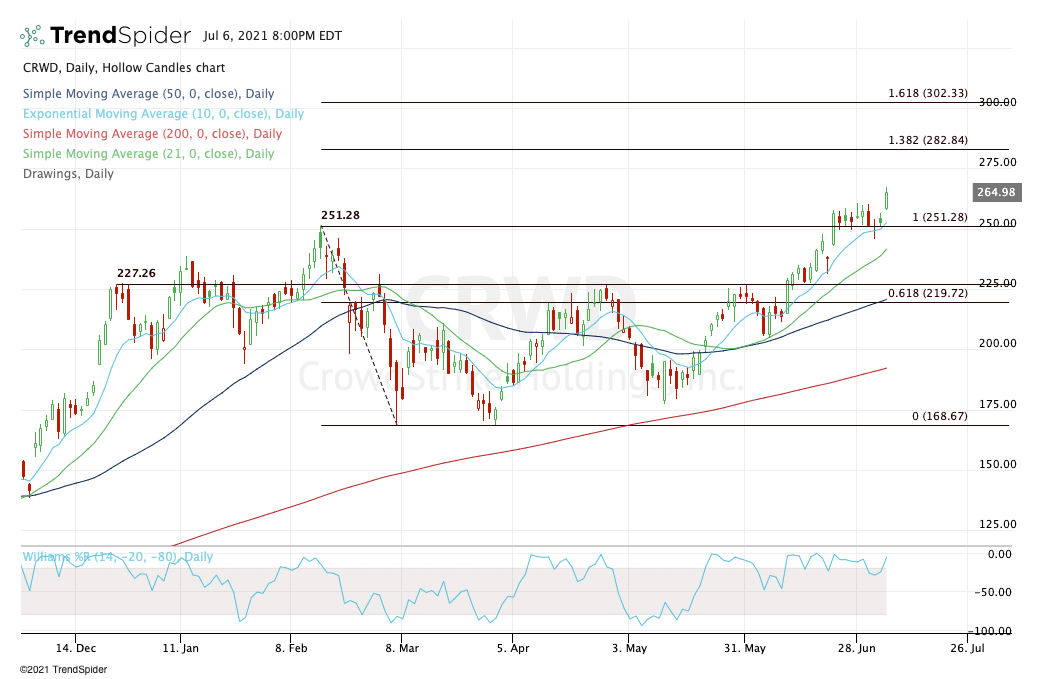
CrowdStrike is a company someone recently reached out to me about. They asked if the stock looked good. Well, it looked great if they were already long. Shares had powered through the prior high of $251.28 and had held that mark for several days.
And that was exactly my response. However, I said if someone was looking to buy, they may want to wait for a reset back to the 10-day moving average. It would take about a week, but patient traders got their setup.
Initially, the 10-day broke as support. But by the close, CRWD had recovered this mark and had closed near that critical $251.28 area with a doji candle.
Now pushing to all-time highs once again, investors should keep an eye on the $275 to $283 area. Above that opens the door to the $300 mark, although there will likely be dips along the way.
DocuSign (DOCU)
Click to Enlarge
DocuSign was one of the hottest plays due to the novel coronavirus. The thing is, this company had a great business before the pandemic and it should have a great business even as we exit the pandemic.
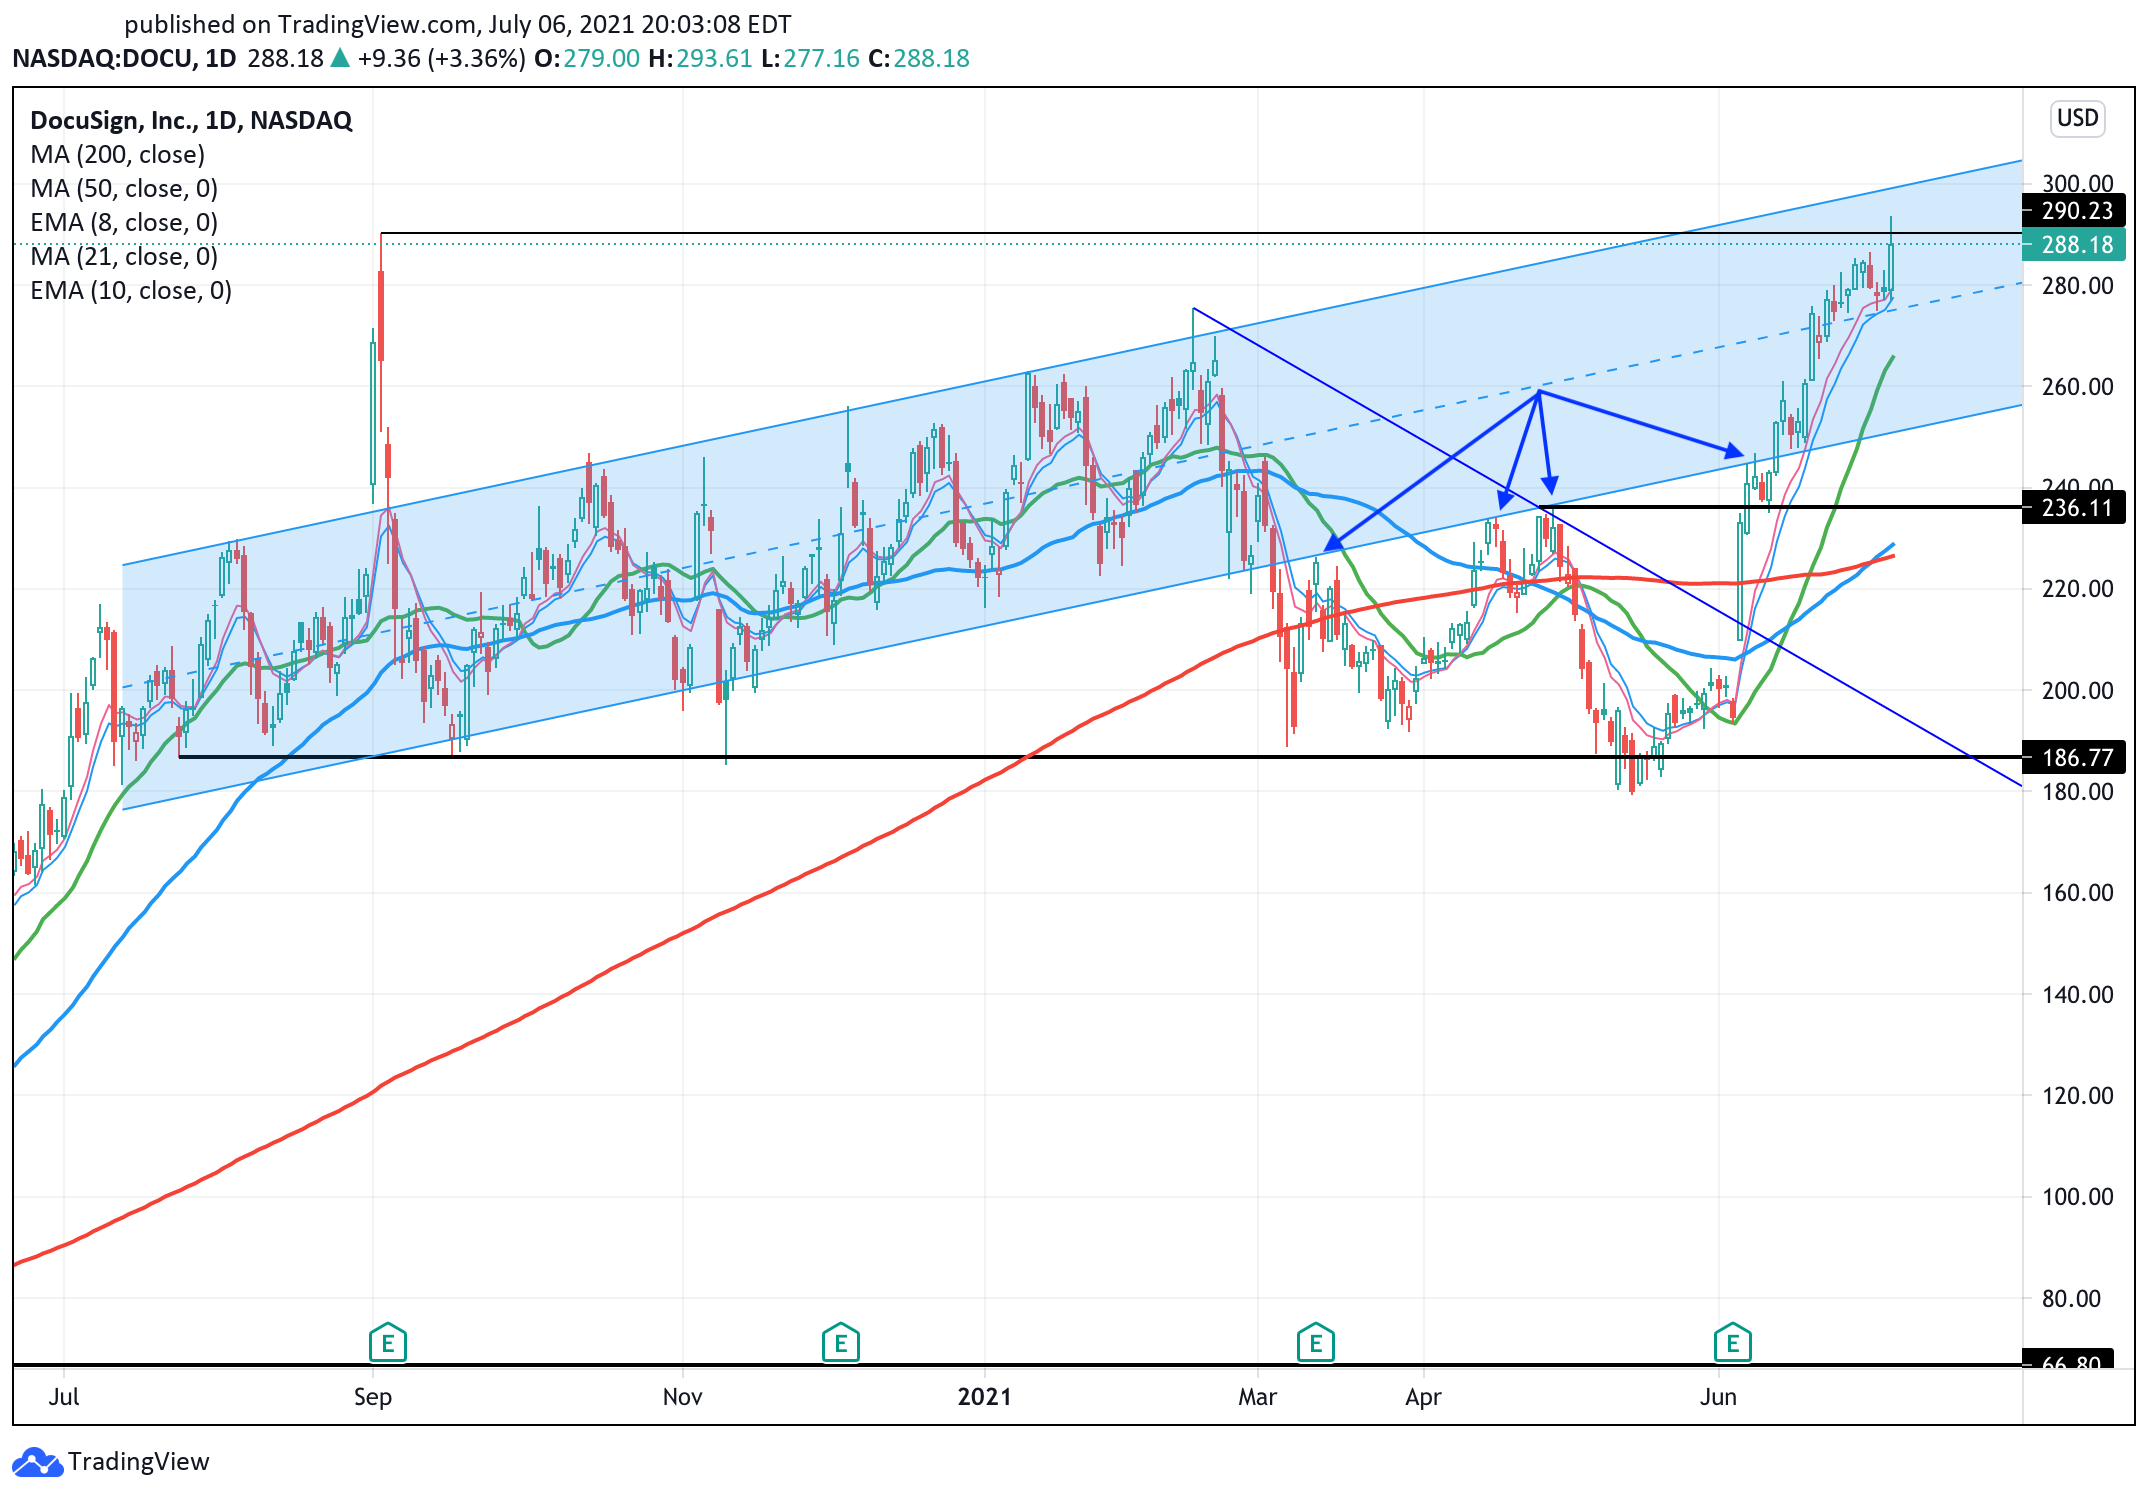
Shares topped out near $300 in September 2020, before retreating into a channel. Despite months of being channel-locked, DocuSign broke below support in March. This channel support level then became resistance for several months, rejecting each of the stock’s rallies. Once reclaimed, the channel once again acted as support.
Honestly, DocuSign is a chart to print off if you want a solid look at channels. In any case, this stock has been on fire since bottoming a few months ago. Each dip to the 8-day and 10-day moving averages has ignited an even sharper rally. The latest dip sent the stock to new all-time highs this week.
Shares pulled back to the 10-day moving average and gave us a doji close. Two days later it cleared $290. From here, keep an eye on its short-term moving averages. A break could put the 21-day moving average in play. On the upside, the $300 to $310 area is in focus, along with channel resistance.
At some point, this stock will need to consolidate. However, there’s no denying it has one of the strongest charts among tech stocks.
Twilio (TWLO)
Click to Enlarge
Despite the strength in the overall market, there’s no denying the bear market that hit growth stocks. Amid that decline, I made the case for buying the deep dip in high-quality growth stocks.
Nothing had changed with the businesses. It was simply a volatile change in sentiment that was souring these names. Among those names was Twilio.
Twilio is an incredibly well-run business that will be successful for years to come. While it was a big beneficiary of the pandemic, its stock did not deserve to fall 40%, in my opinion.
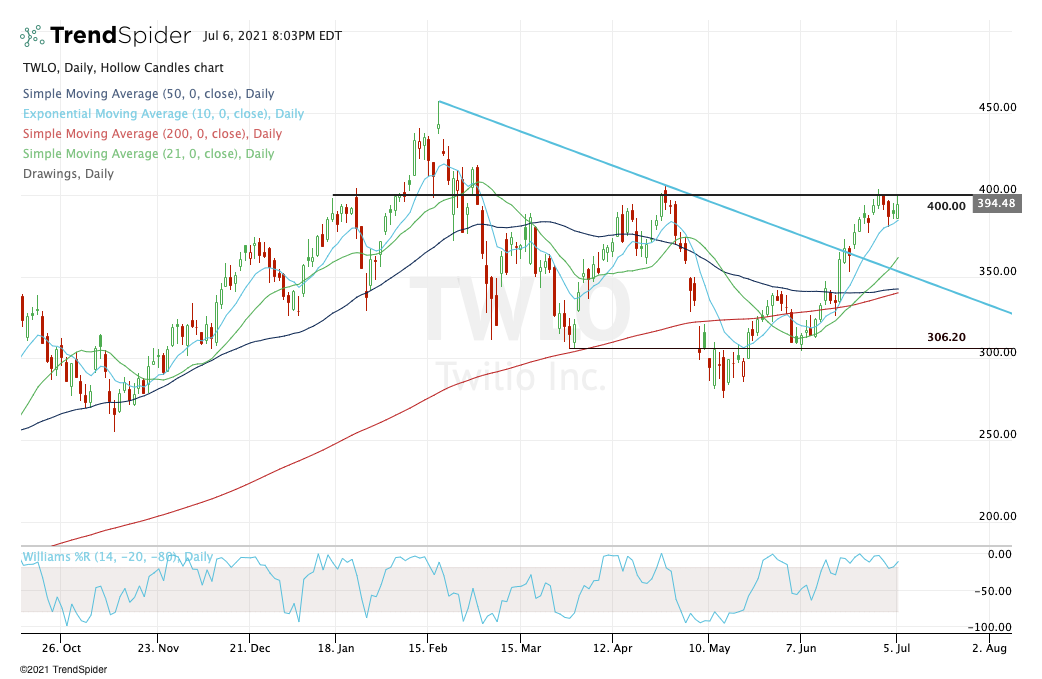
After suffering a peak-to-trough decline of about 40% — which is the threshold I look for on these kinds of dips — Twilio had an uphill battle to fight. It had to push through both its short- and long-term moving averages, then push through downtrend resistance (the blue line on the chart).
So far, it has done so with impressive strength. Now it’s running into the $400 mark. This level has been a tough spot for the stock all year long. It’s consolidating nicely now and if Twilio can push higher, a retest of the highs near $450 could be on the table. Above that and $500 will quickly come into focus.
On the downside, a break of the 10-day moving average could put the 10-day moving average in play, as well as a retest of prior downtrend resistance.
Roku (ROKU)

Click to Enlarge
Like Twilio, Roku also suffered a tough decline, falling about 44% from the highs. While it has yet to recover to all-time highs, ROKU stock has enjoyed a sharp rally off the lows.
Roku is now resetting against the 10-day moving average, giving disciplined traders a tempting risk-reward setup. More aggressive traders were buying below $427, while more conservative traders will likely wait for some sort of “proof” from the stock, likely in the form of a rotation.
More specifically, a rotation over this week’s high could put the $450 to $460 area on the table. If Roku can clear the recent high (at $462.99), it could put the $480 to $485 zone in play. Above that and $500 is an obvious magnet.
This may be one of the strongest tech stocks out there of late. However, given the sharp rally, investors need to be aware of the potential for a dip. A close below the 10-day moving average could usher in a dip down to the 21-day, and possibly a retest of the $370 to $375 zone.
Nvidia (NVDA)

Click to Enlarge
Are we saving the best for last? It sure seems that way when Nvidia is all the way down here. Like Amazon, Nvidia had been consolidating for quite some time, despite robust earnings results and incredible management. It was only a matter of when Nvidia would break to new highs, not if.
In April, shares broke out over $588 range resistance and ran to new all-time highs near $650. It looked like this was the breakout we had been waiting for. But alas, the stock had one last nasty pullback in store as growth stocks endured the final leg down in their bear market.
After Wall Street booed Nvidia’s stellar earnings result, it didn’t take long for shares to explode higher. This is without a doubt the best-looking chart among tech stocks.
Now up for eight straight weeks, I have no idea when Nvidia will pull back and/or consolidate. The company is sporting a $500-plus billion market capitalization and now running into the 261.8% extensions from its various ranges over the last 12 months.
With its stock split later this month, perhaps more gains are possible. Either way, I’m a big buyer of this one on the dips.
Shopify (SHOP)

Click to Enlarge
Shopify and Nvidia aren’t all that different. They both were weighed down during the growth-stock bear market, but didn’t suffer the same painful fate as many others. Check out the price chart.
The $1,000 to $1,050 area was clear resistance in Q2, Q3 and Q4 of 2020. Then in Q1 and Q2 of 2021, it was clear support. This is what traders should be looking for when trading range-bound stocks.
It helps that Shopify also broke out over downtrend resistance (blue line), then saw that level turn to support as well. Tie in both of those areas with the 50-week moving average and voila, we have a trifecta of support near $1,000.
And for those that don’t find technical analysis meaningful at all yet made it to the end of this gallery, you may notice that it’s no coincidence Shopify shares are up 50% from the May lows. If the stock breaks out and continues higher, keep an eye on the $1,750 to $1,800 zone.
Otherwise, look to buy on the dip.
On the date of publication, Bret Kenwell held a long position in NVDA, TWLO and ROKU. The opinions expressed in this article are those of the writer, subject to the InvestorPlace.com Publishing Guidelines.
Bret Kenwell is the manager and author of Future Blue Chips and is on Twitter @BretKenwell.