
The cryptocurrency space has not had an easy go of it. The two leaders, Bitcoin (BTC-USD) and Ethereum (ETH-USD) are down 6% and 7% over the past five days, respectively. From the recent high, ETH-USD is down 18.5%.
Amid the decline, Ethereum has dropped under $3,000 for the first time since mid-March. Once the stock market hit its low in mid-March, many stocks began to fly higher. Everything from Tesla (NASDAQ:TSLA) to AbbVie (NYSE:ABBV
) moved higher. Amid that run, growth stocks received some much-needed reprieve.
To my eye, it looks like the rally in these stocks also helped lift cryptocurrencies. Both groups — growth stocks and cryptocurrencies — show a healthy appetite for “risk” when they’re rallying. That’s as they’re more volatile than some of the market’s more blue-chip holdings and investors show they are willing to take on more risk.
Since that rally though, we’ve seen both growth stocks and cryptocurrencies pull back. Some investors may blame it on mining difficulty, a catalyst that some crypto investors attribute to the decline we saw in mid-summer. Others may simply blame it on the continued volatility in the market.
Despite optimism about a software upgrade for Ethereum, we can’t ignore the short-term price action.
Click to Enlarge
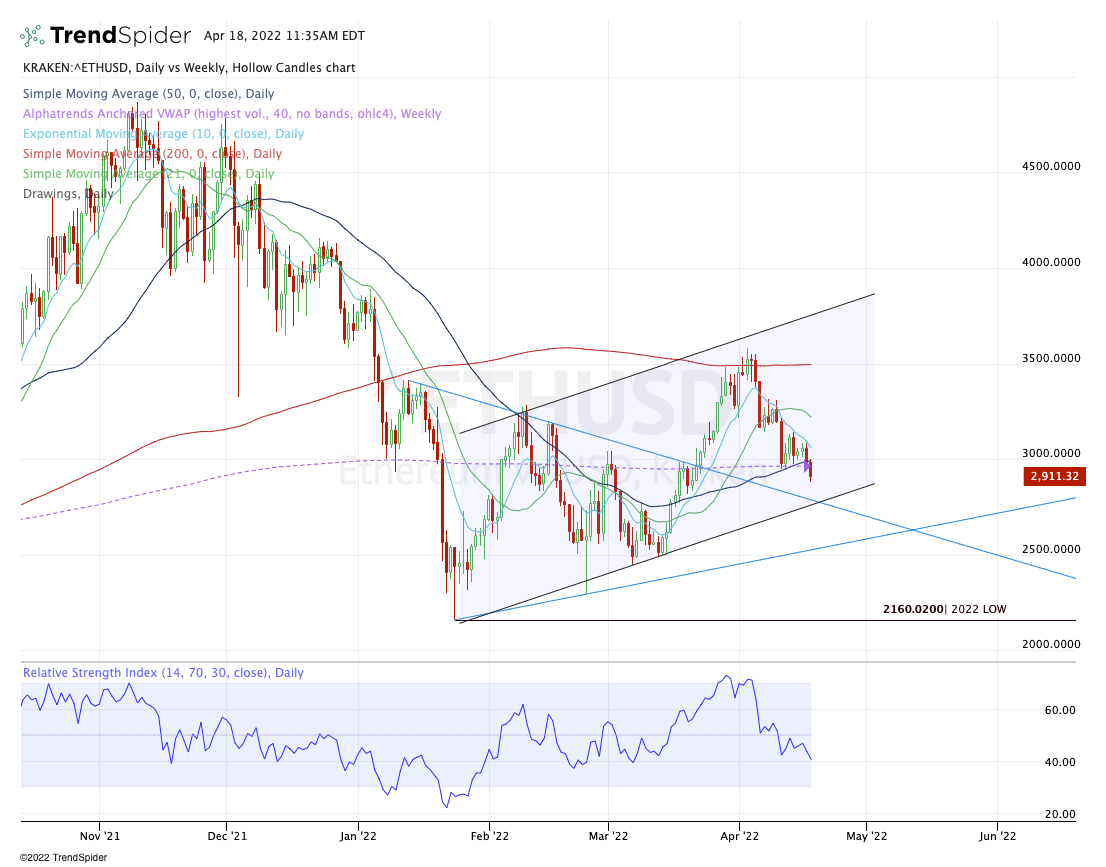
As I look at Ethereum, I see a rising channel. The good news is that ETH-USD remains range bound. Channel resistance has been resistance and channel support has been support. The latter remains in play.
The bad news? Ethereum is trading below all of its daily moving averages, while the 10-day continues to squeeze it lower. Further, it’s dropping below the 50-day moving average and the weekly volume-weighted average price (VWAP) measure on Monday.
If it continues lower, I consider the $2,750 to $2,800 area a must-hold support zone. There it finds the backside of prior downtrend resistance and channel support. A close below this area exposes ETH-USD to more downside. Specifically, it could put $2,500 in play. Below the March low at $2,445 could put this year’s low in play at $2,160.
On the upside, Ethereum needs to reclaim $3,000 and the declining 10-day moving average. If it can do that, it could open the door back to $3,500 and the 200-day moving average, followed by this month’s high at $3,580 and channel resistance.
On the date of publication, Bret Kenwell did not have (either directly or indirectly) any positions in the securities mentioned in this article. The opinions expressed in this article are those of the writer, subject to the InvestorPlace.com Publishing Guidelines.