
Let’s draw some lines and have a good time! SoFi Technologies (NASDAQ:SOFI) just posted a highly positive second-quarter 2024 financial report. This could allow the buyers to take control of the stock’s price action. With just a few chart lines, a quick SOFI technical analysis will surely convince you that SoFi stock is on its way to $10 or even higher.
Just to recap, SoFi Technologies’ Q2-2024 adjusted net revenue of around $597 million beat Wall Street’s consensus estimate of $565 million. Furthermore, SoFi Technologies raised its full-year 2024 adjusted net revenue guidance range from $2.39 to $2.43 billion previously, to $2.425 to $2.465 billion currently.
Thus, SoFi Technologies’ long-term investors can breathe a sigh of relief. The company passed the quarterly-results test with flying colors, and now it’s time to check the chart and see what the lines are telling us.
SoFi Stock Moving Averages: It’s Getting Exciting!
The quarterly report is in the rear-view mirror, so SoFi Technologies’ shareholders can relax a little bit. However, don’t get complacent as the moving averages show that buyers haven’t cleared all of the hurdles yet.
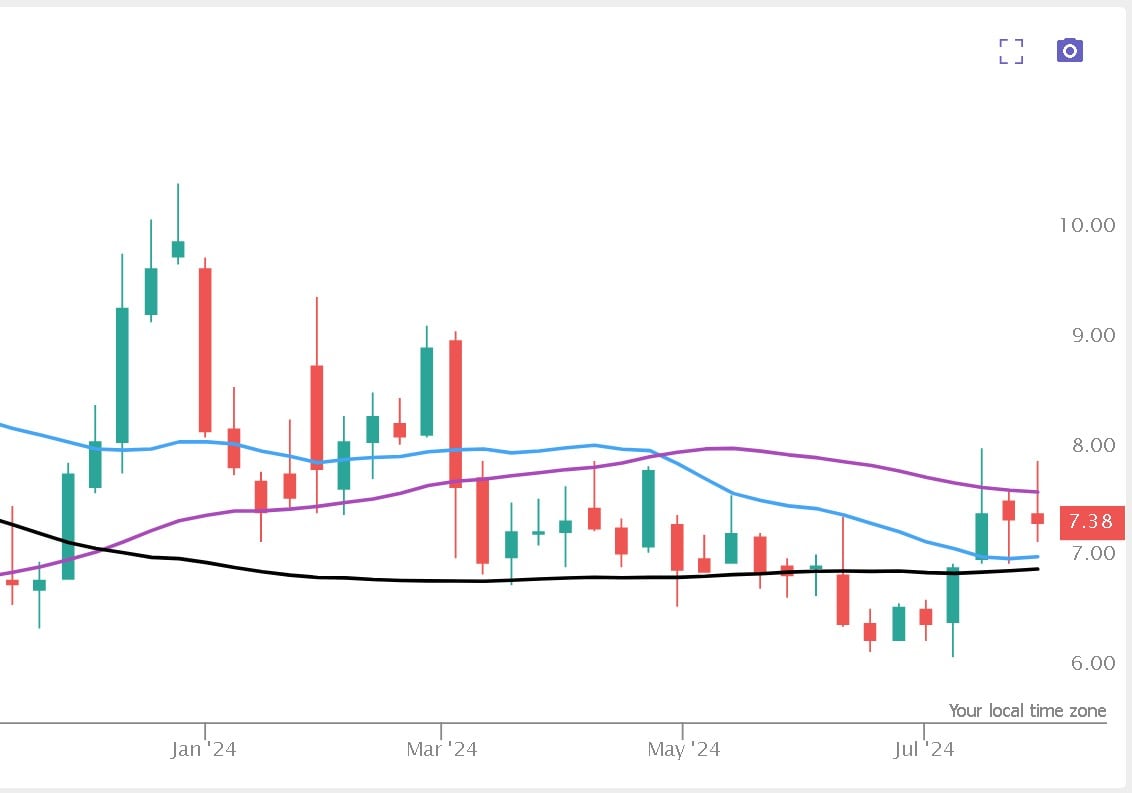
This is a weekly candlestick chart of SoFi stock. So, the most recent candlestick reflects more than just Tuesday’s post-earnings share-price move. What’s most important here is that the stock is above the 100-day moving average (in black) and the 20-day moving average (in blue).
Furthermore, the buyers are making an effort to push SoFi Technologies stock above the 50-day moving average (in purple) and keep it there. That’s easier said than done, of course.
Still, clearing the 50-day moving average would put the bulls in the driver’s seat, psychologically speaking. It would also probably cause the three moving averages to trend upwards.
Is This Just a Coincidence, or What?
Sticking with the weekly candlestick chart, SoFi Technologies stock has some overhead resistance levels to clear. This should be easier, now that investors don’t have to fear an earnings-event disaster.
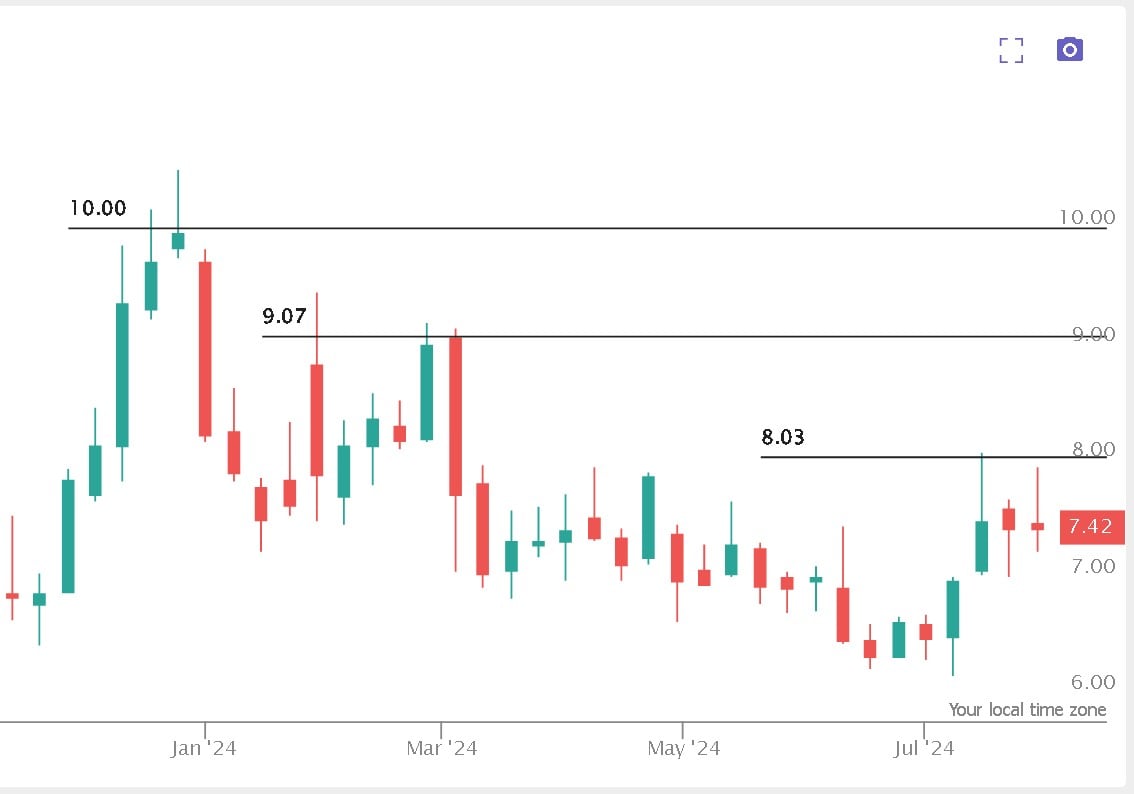
This is actually a little bit spooky! Is it just a coincidence that SoFi stock’s resistance levels are so close to $8, $9 and $10? I’ll let you decide if there are any conspiracy theories worth investigating here.
The thing about resistance levels is that clearing one level tends to add psychological fuel for the buyers. This, in turn, tends to lead to clearing the next level, and so on. It’s a virtuous cycle, you might say.
But let’s not get ahead of ourselves. Getting SoFi Technologies stock above $8, especially if it happens on high trading volume, would be a victory worth celebrating.
SOFI Technical Analysis: All Eyes on the $10 Prize!
At this point, there’s no need to worry about SoFi Technologies delivering a terrible quarterly report. Now, investors can monitor the share price and see if it clears all of the important moving averages and resistance levels.
Importantly, there’s hope on the horizon for the bulls. SOFI technical analysis suggests that $8 and $9 are near-term goals, after which $10 will be easier to attain. Therefore, investors should consider buying a few shares of SoFi stock.
On the date of publication, David Moadel did not have (either directly or indirectly) any positions in the securities mentioned in this article. The opinions expressed in this article are those of the writer, subject to the InvestorPlace.com Publishing Guidelines.
On the date of publication, the responsible editor did not have (either directly or indirectly) any positions in the securities mentioned in this article.