


In case you haven’t noticed, tech stocks have been shaking out of their bear market slump recently. And they’ve been surging higher over the past month. Some investment pros are calling this move a head fake – just another bear market rally.
But an increasing number are saying this rally is the real deal. And I just put together one chart that shows the bulls could be right: This could be the start of a big breakout in tech stocks.
Specifically, tech stocks look like they bottomed in mid-June. Since then, the tech-heavy Nasdaq has popped more than 10%. Some tech stocks have risen almost 25%.
This price action is telling us something.
Still, there are a lot of bears out there calling this another bear market rally. To those investors: I have one chart that you need to see.
And honestly, I’m not considering the possibility that bears aren’t convinced because this chart is just that convincing.
Tech stocks look ready for a big 12-month breakout.
Let’s take a deeper look.
A Single Chart Is Worth a Thousand Words
Yesterday, I came across some very interesting analysis on Bloomberg. It illustrates the recent outperformance in tech stocks through some critical technical indicators. I played around with that Bloomberg data and added my own layer of analysis. And I’ve put together a chart that’ll convince even the staunchest bears that a big tech stock breakout is likely.
The initial Bloomberg data graphed the performance ratio of tech stocks – as measured by the Technology Select Sector SPDR ETF (XLK) – to the S&P 500. It showed that the ratio’s Relative Strength Index crossed above 50 last week for the first time since February. That’s nearly six months.
That data was pretty convincing in showing that a “real deal” tech stock breakout was upon us. Traders often perceive a bullish RSI crossover to above 50 as a sign of a healthy turnaround rally getting underway. We just saw that bullish signal flash in the outperformance ratio, implying a turnaround rally in tech stocks is underway.
But I remained unconvinced.
So, I continued to dig. Has this bullish RSI crossover signal happened before, where it spent months under 50 and then bullishly broke above it? If so, what happened after those previous instances?
As it turns out, this crossover signal is rare, but it’s also super bullish.
It has only happened three times over the past 12 years. Once was in mid-2011 on the heels of the European debt crisis. The others happened in late 2013 and early 2019.
Each time, tech stocks were crashing prior to the bullish crossover signal. Each time, they proceeded to flip around and rally big after the crossover. After the 2011 crossover, tech stocks popped nearly 20% in about a year. After the 2013 crossover, tech stocks ripped 22% higher in a year. And after the 2019 crossover, tech stocks surged 50% higher in a year.
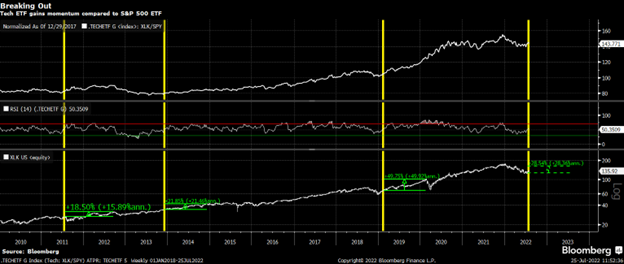
We just had one of those crossover signals. If the historical pattern continues, then tech stocks are on the verge of flipping from crashing to rallying. And they will rise by about 30% over the next year.
In other words, tech stocks are breaking out in a way they’ve only done three times before over the past 12 years. And each time, these technically unique breakouts led to much bigger rallies over the subsequent year.
Time to get bullish on tech stocks? We think so.
The Final Word on the Breakout in Tech Stocks
We think the markets are in the midst of a generational turnaround, from late-cycle bear market to early-cycle bull market.
These are when fortunes are made in the stock market.
The last time we made a generational turnaround like this was in 2020. Before that, it was in 2009. And in each year, high-growth tech stocks absolutely soared and allowed investors to become filthy rich in a short time.
In 2009, a stunning 25 stocks soared 10X or more (versus an average of three in previous years), including Compugen
(CGEN) which soared 1,027%, Avis Budget (CAR) which popped 1,748%, and Sleep Number (SNBR) which soared 2,407%.
In 2020, another 25 stocks soared 10X or more, led by Bit Digital (BTBT) soaring 5,377%, Novavax (NVAX) popping 2,694%, and Blink Charging (BLNK) charging 2,186% higher (fun fact: We called that last one).
Get the point?
Generational bear-to-bull-market turnarounds only happen about once a decade. And when they emerge, astute investors make fortunes overnight.
We think that very turnaround is upon us right now. That means if you plug into the right stocks today, you could make big money over the next 12 months.
Find out the best stocks to buy today for 10X gains in 2023.
On the date of publication, Luke Lango did not have (either directly or indirectly) any positions in the securities mentioned in this article.