

Believe it or not, stocks are absolutely soaring this year – and my favorite technical stock indicators suggest that the party is just getting started.
Year-to-date, the S&P 500 is up an impressive 12%. The tech-heavy Nasdaq is faring even better, rising more than 26% in 2023.
The stock market rally is being driven by a combination of falling inflation, a re-stabilizing economy, and prospects for a pause in the Fed’s rate-hike campaign. Euphoria about emerging artificial intelligence (AI) technologies is also providing an extra boost to tech stocks, and in particular, AI stocks. The Global X Artificial Intelligence ETF (AIQ) is up 33% in 2023.
It’s been a great year for investors, especially tech investors.
But some folks are still cautious. Reasonably so – last year was a horrendous year for investors. In fact, it was one of the worst years ever for investors. Coming off that beatdown, it is only natural for them to be skeptical of the 2023 stock market rally.
Mark my words, though: This rally is the real deal.
This is the big one.
This is the start of not just a new bull market, but potentially one of the biggest bull markets in history – a bull market that I think will look a lot like the great dot-com boom that lasted throughout the entire 1990s and minted fortunes for internet investors.
I’m very confident in saying that.
Why? Because I’m a numbers guy. I follow the data. And the data is screaming the exact same conclusion: This stock market rally could turn into something really, really big.
Specifically, my favorite technical indicator – the “Holy Trinity” of upside catalysts, as I like to call it – has been triggered. And it suggests that we are on the cusp of a big stock market melt-up.
Stock Indicators Point to a Major Melt-Up
This “Holy Trinity” includes the following:
The Triple Barrel
The “Triple Barrel” buy signal was triggered earlier this year, and it has a 100% track record of calling massive stock market rallies. This indicator flashes when three ultra-rare breadth thrust signals – the Breakaway Momentum, Whaley, and Triple 70 breadth thrusts – are triggered all at once. This has happened seven times before in history. All seven times, stocks soared over the next three, six, nine, and 12 months. Average 12-month returns were in excess of 25%.
![]()
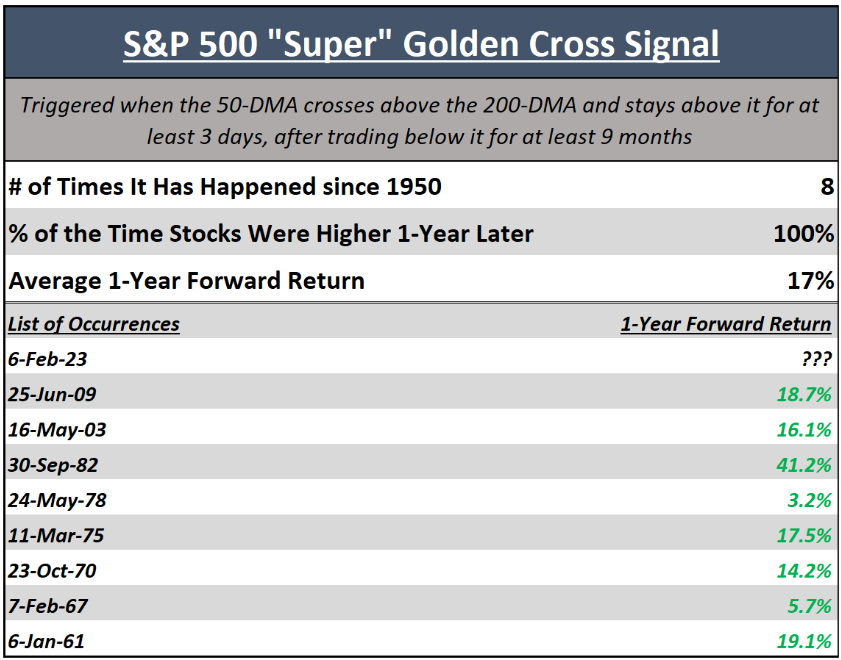
The Super Golden Cross
The “Super Golden Cross” was also triggered earlier this year, and it also has a 100% track record of calling massive stock market rallies.
In traditional technical analysis, a golden cross is triggered when a short-term moving average on a stock (like the 50-day) flips above a long-term moving average (like the 200-day). It is usually bullish. Now, we have created a special type of golden cross called the “Super Golden Cross” signal, which is always bullish.
The Super Golden Cross is triggered when the 50-day moving average crosses above the 200-day and stays above it for more than three days after spending the previous nine-plus months trading below it. Between 1950 and 2022, this Super Golden Cross Signal was triggered eight times. And every time, it marked the end of a bear market and the beginning of a new bull market. The average 12-month forward returns in the S&P 500 were 17%. This infallible Super Golden Cross signal was just triggered in the S&P 500 earlier this year.
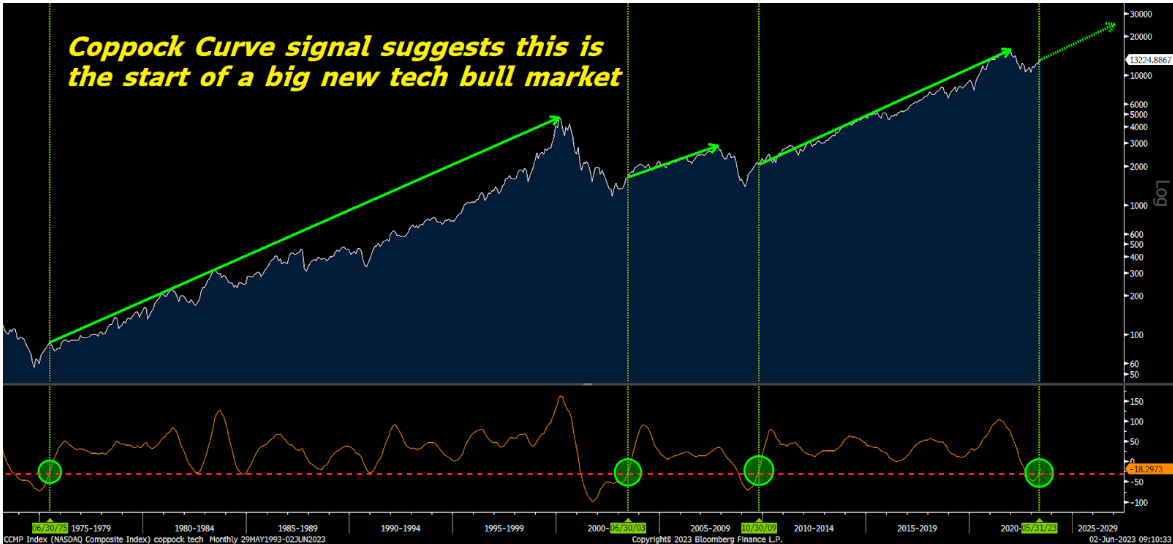
The Coppock Curve
The Coppock Curve for tech stocks just triggered a rare buy signal, which has a 100% track record of calling massive tech bull markets. One of the best long-term market trend indicators is the Coppock Curve, which measures medium- and long-term momentum in the stock market and is designed to indicate critical turning points in market momentum between bearish and bullish. The Coppock Curve on tech stocks just flashed a very bullish signal that has only occurred three times before in history. Each time, it marked the beginning of a multi-year, secular tech bull market.
In other words, folks, the Holy Trinity of upside catalysts comprises three ultra-rare, ultra-powerful technical indicators. All have a 100% historical track record of calling big market rallies.
And all three have been triggered in 2023.
The Final Word on the “Holy Trinity” Stock Indicators
That’s why I’m confident this is the start of something really special – something really big.
The data very convincingly says as much.
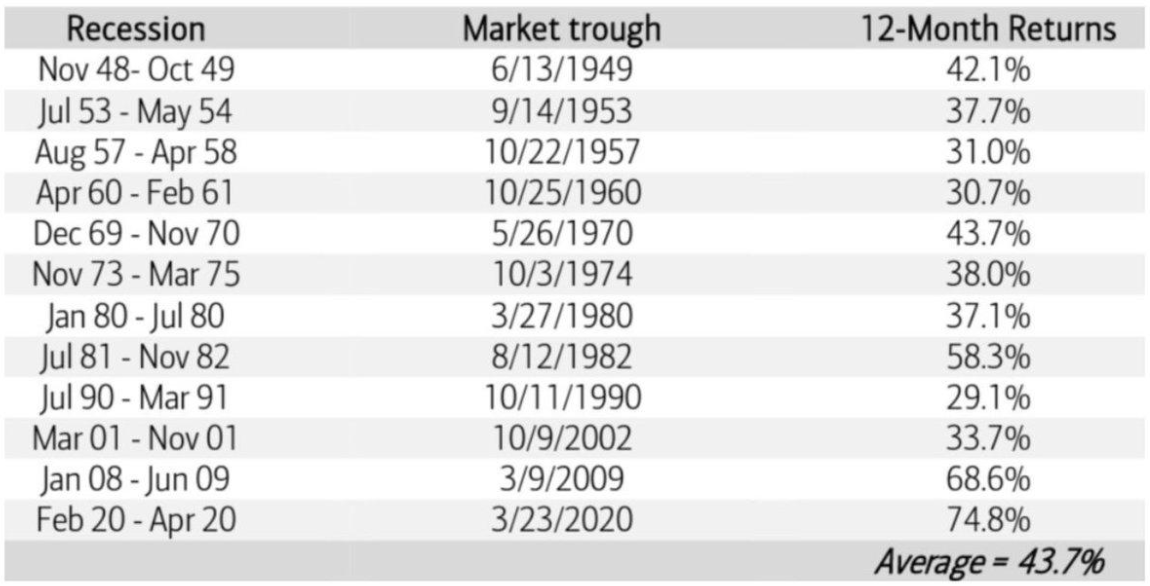
I don’t want you to miss out on this potentially huge incoming bull market because the reality is that the biggest gains in a new bull market happen in its first few innings. In fact, in the first year of a new bull market, stocks tend to soar almost 50%!
But time is running out! To fully capitalize on this new bull market, you must act now. Especially when you consider that the biggest potential catalyst for this bull market – a potential “Fed Pause” – is just two weeks away…
That’s why, this Tuesday at 7 p.m. EST, I will be hosting an emergency briefing to detail what you need to do right now to get prepared for this emerging tech-powered bull market.
These are actions you need to take now, before the Fed pause.
While I present quite frequently, I think this may be the most timely presentation of my career by far.
Which is why you need to hear what I have to say right now.
So, please join me this Tuesday afternoon, at 7 p.m. EST.
Click here to reserve your seat now.
On the date of publication, Luke Lango did not have (either directly or indirectly) any positions in the securities mentioned in this article.