
A rough close to 2022 in the market has led to a different story in 2023 – at least so far.
As we mentioned on Tuesday, January’s performance is often a good indicator of how the market will fare for the rest of the year.
It’s not an exact science, but the pattern shows that if the market closes lower at the end of January than it did at the beginning, the market could end the year lower. The opposite is also true – a higher end-of-month close to January than its open often correlates with an increase in value for the S&P 500.
For example, last year, the S&P 500 opened on Jan. 3 at 4,778.14 and closed on Jan. 31 at 4,515.55 – a 5.50% decrease. As you know, the S&P ended 2022 at 3,839.50.
Right now, we’re looking at a 0.15% on the week. There are still 14 trading days left in the month, so a lot could go wrong… or right.
But… the S&P 500 is showing signs of hope in 2023.
Here’s what we see for the near future.
Could be like catching the internet boom in the mid-90s, or Bitcoin 10 years ago…
Louis Navellier’s Big Energy Bet is a powerful megatrend that could show you incredible gains of 10x or more. Full details here.
What’s Happening Now
After consolidating in bear-market territory for the last two weeks of 2022, the S&P 500 is finally starting to push back up into bullish territory.
In last Friday’s issue, we discussed how the fate of the S&P 500 in 2023 would depend on the 10-year Treasury yield (TNX).
To recap, we have seen a direct inverse correlation between the value of the TNX and the value of the S&P 500 (SPX) for the past seven months. When the TNX forms lower highs, the SPX forms higher lows.
That relationship appears to be carrying forward into 2023 (see Figs. 1 and 2).
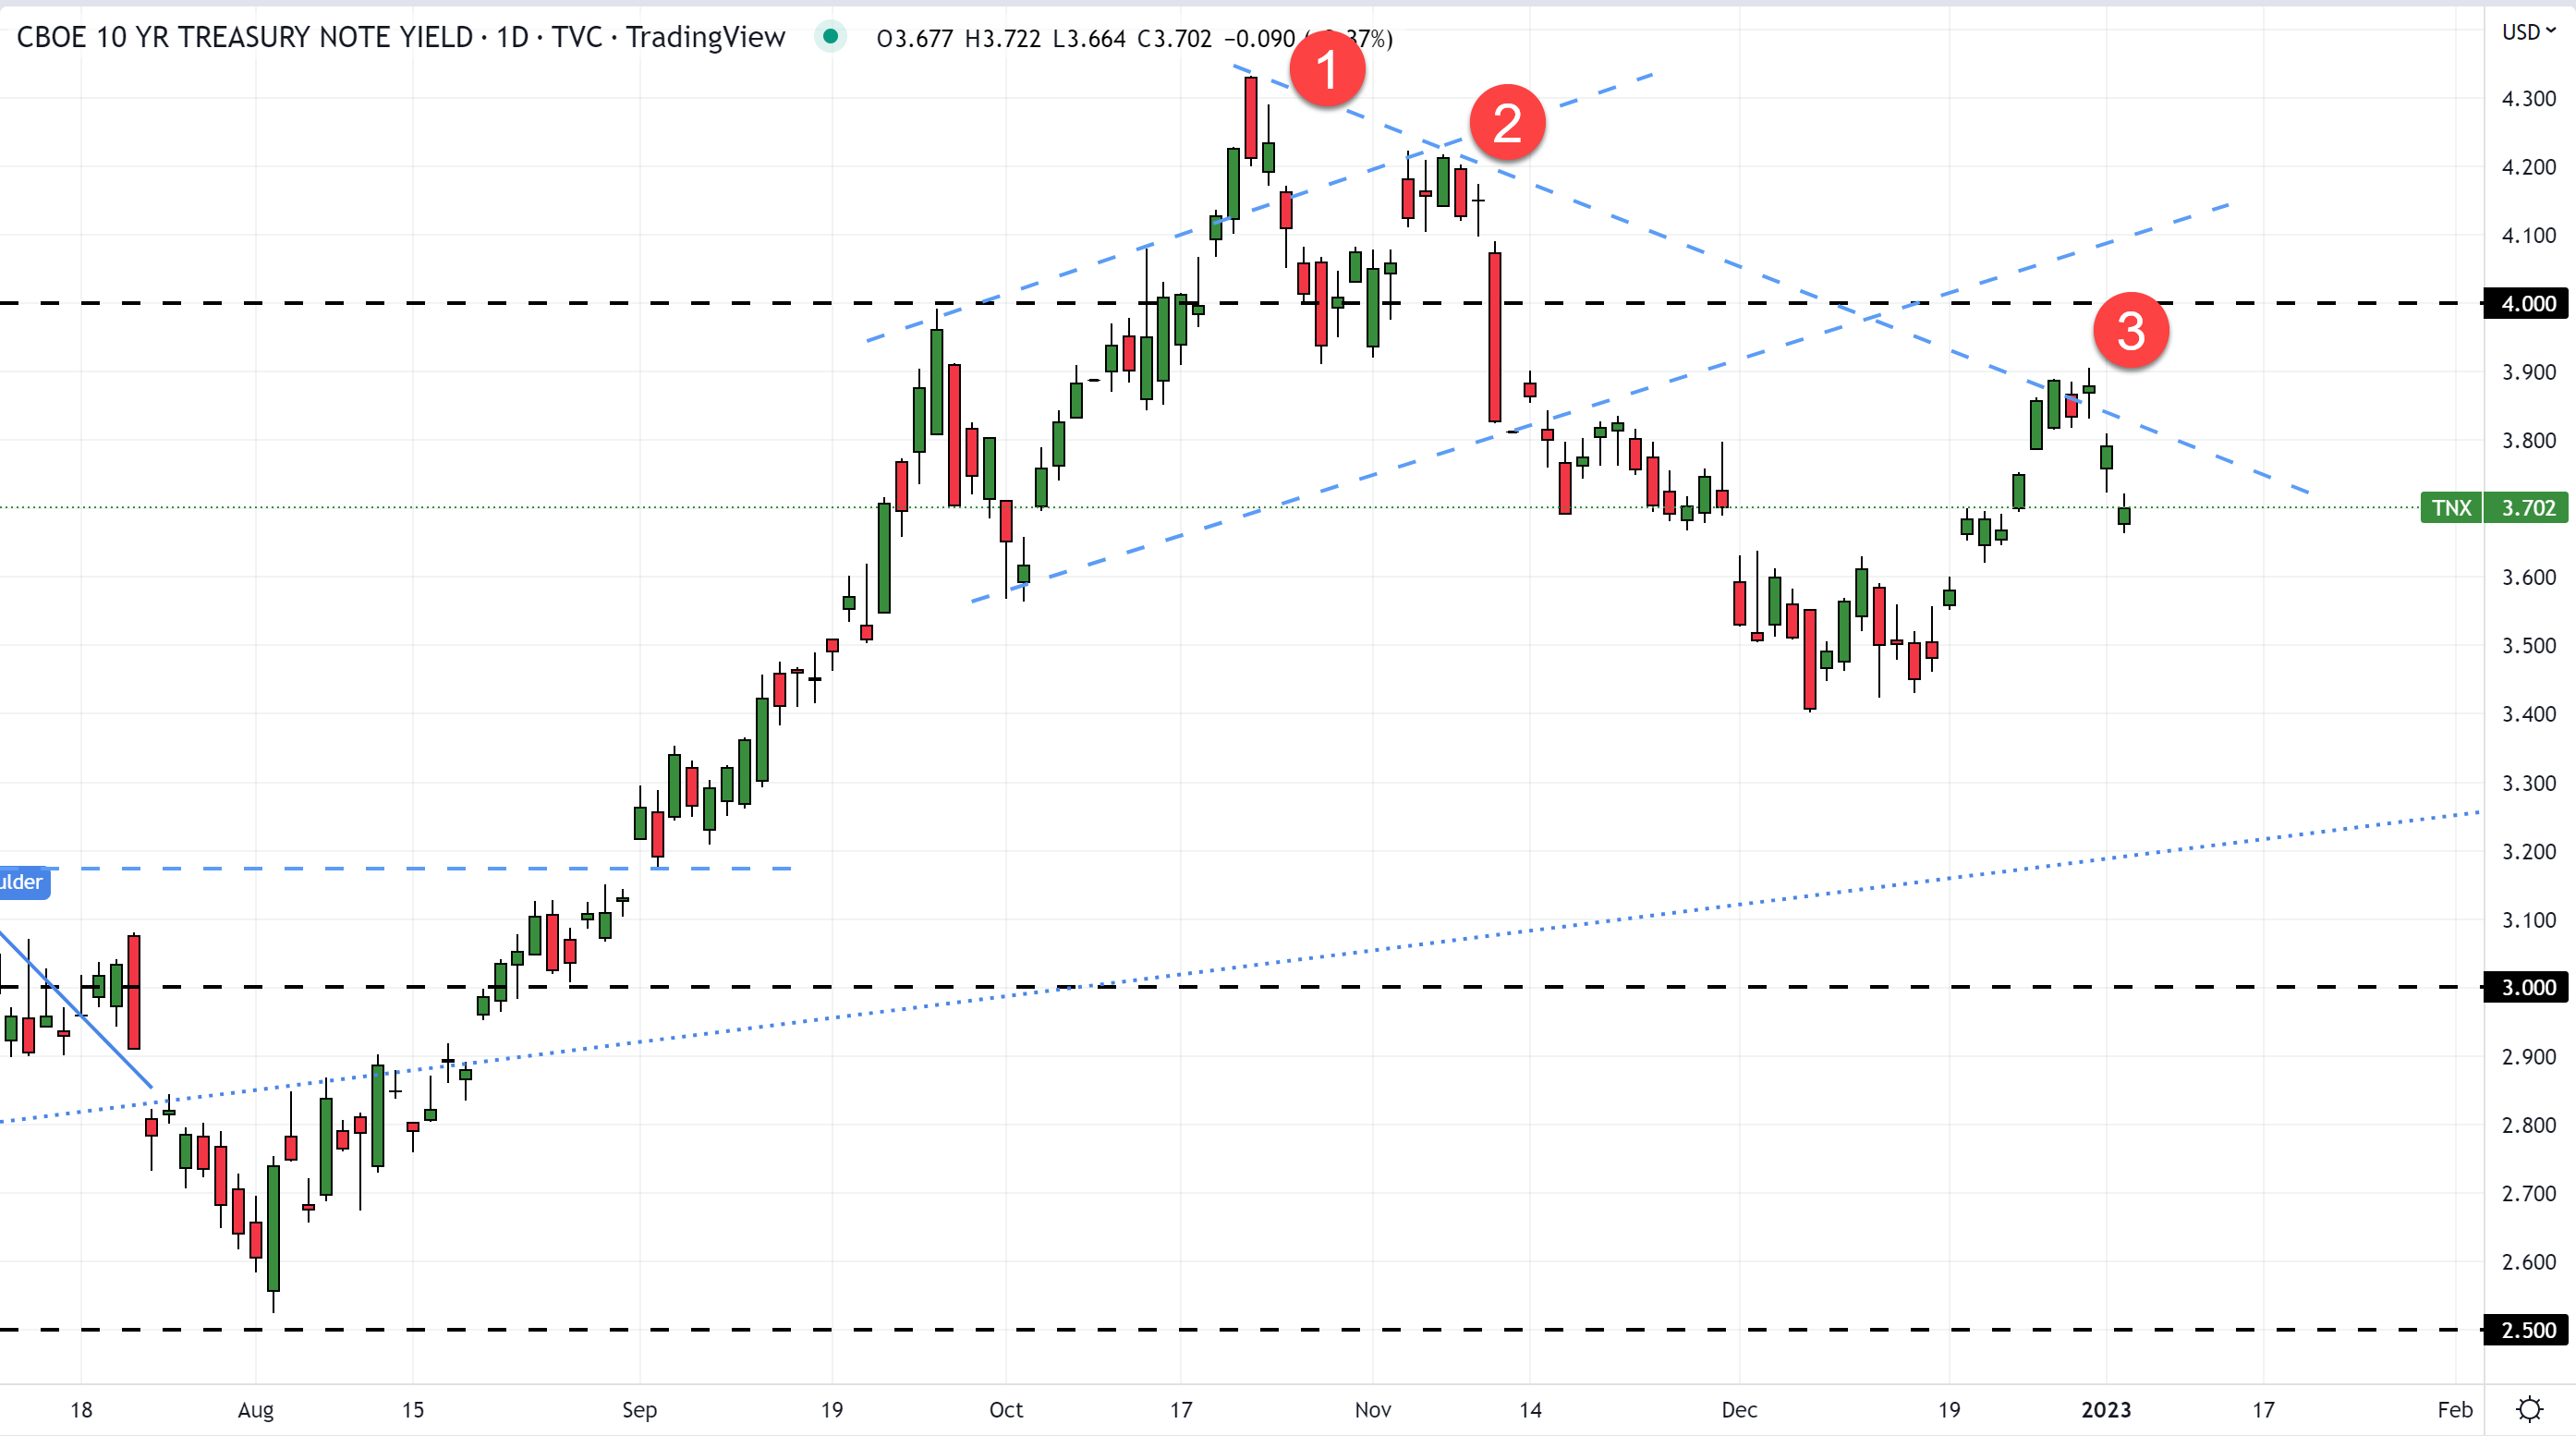
Fig. 1 – Daily Chart of 10-year Treasury Yield (TNX)
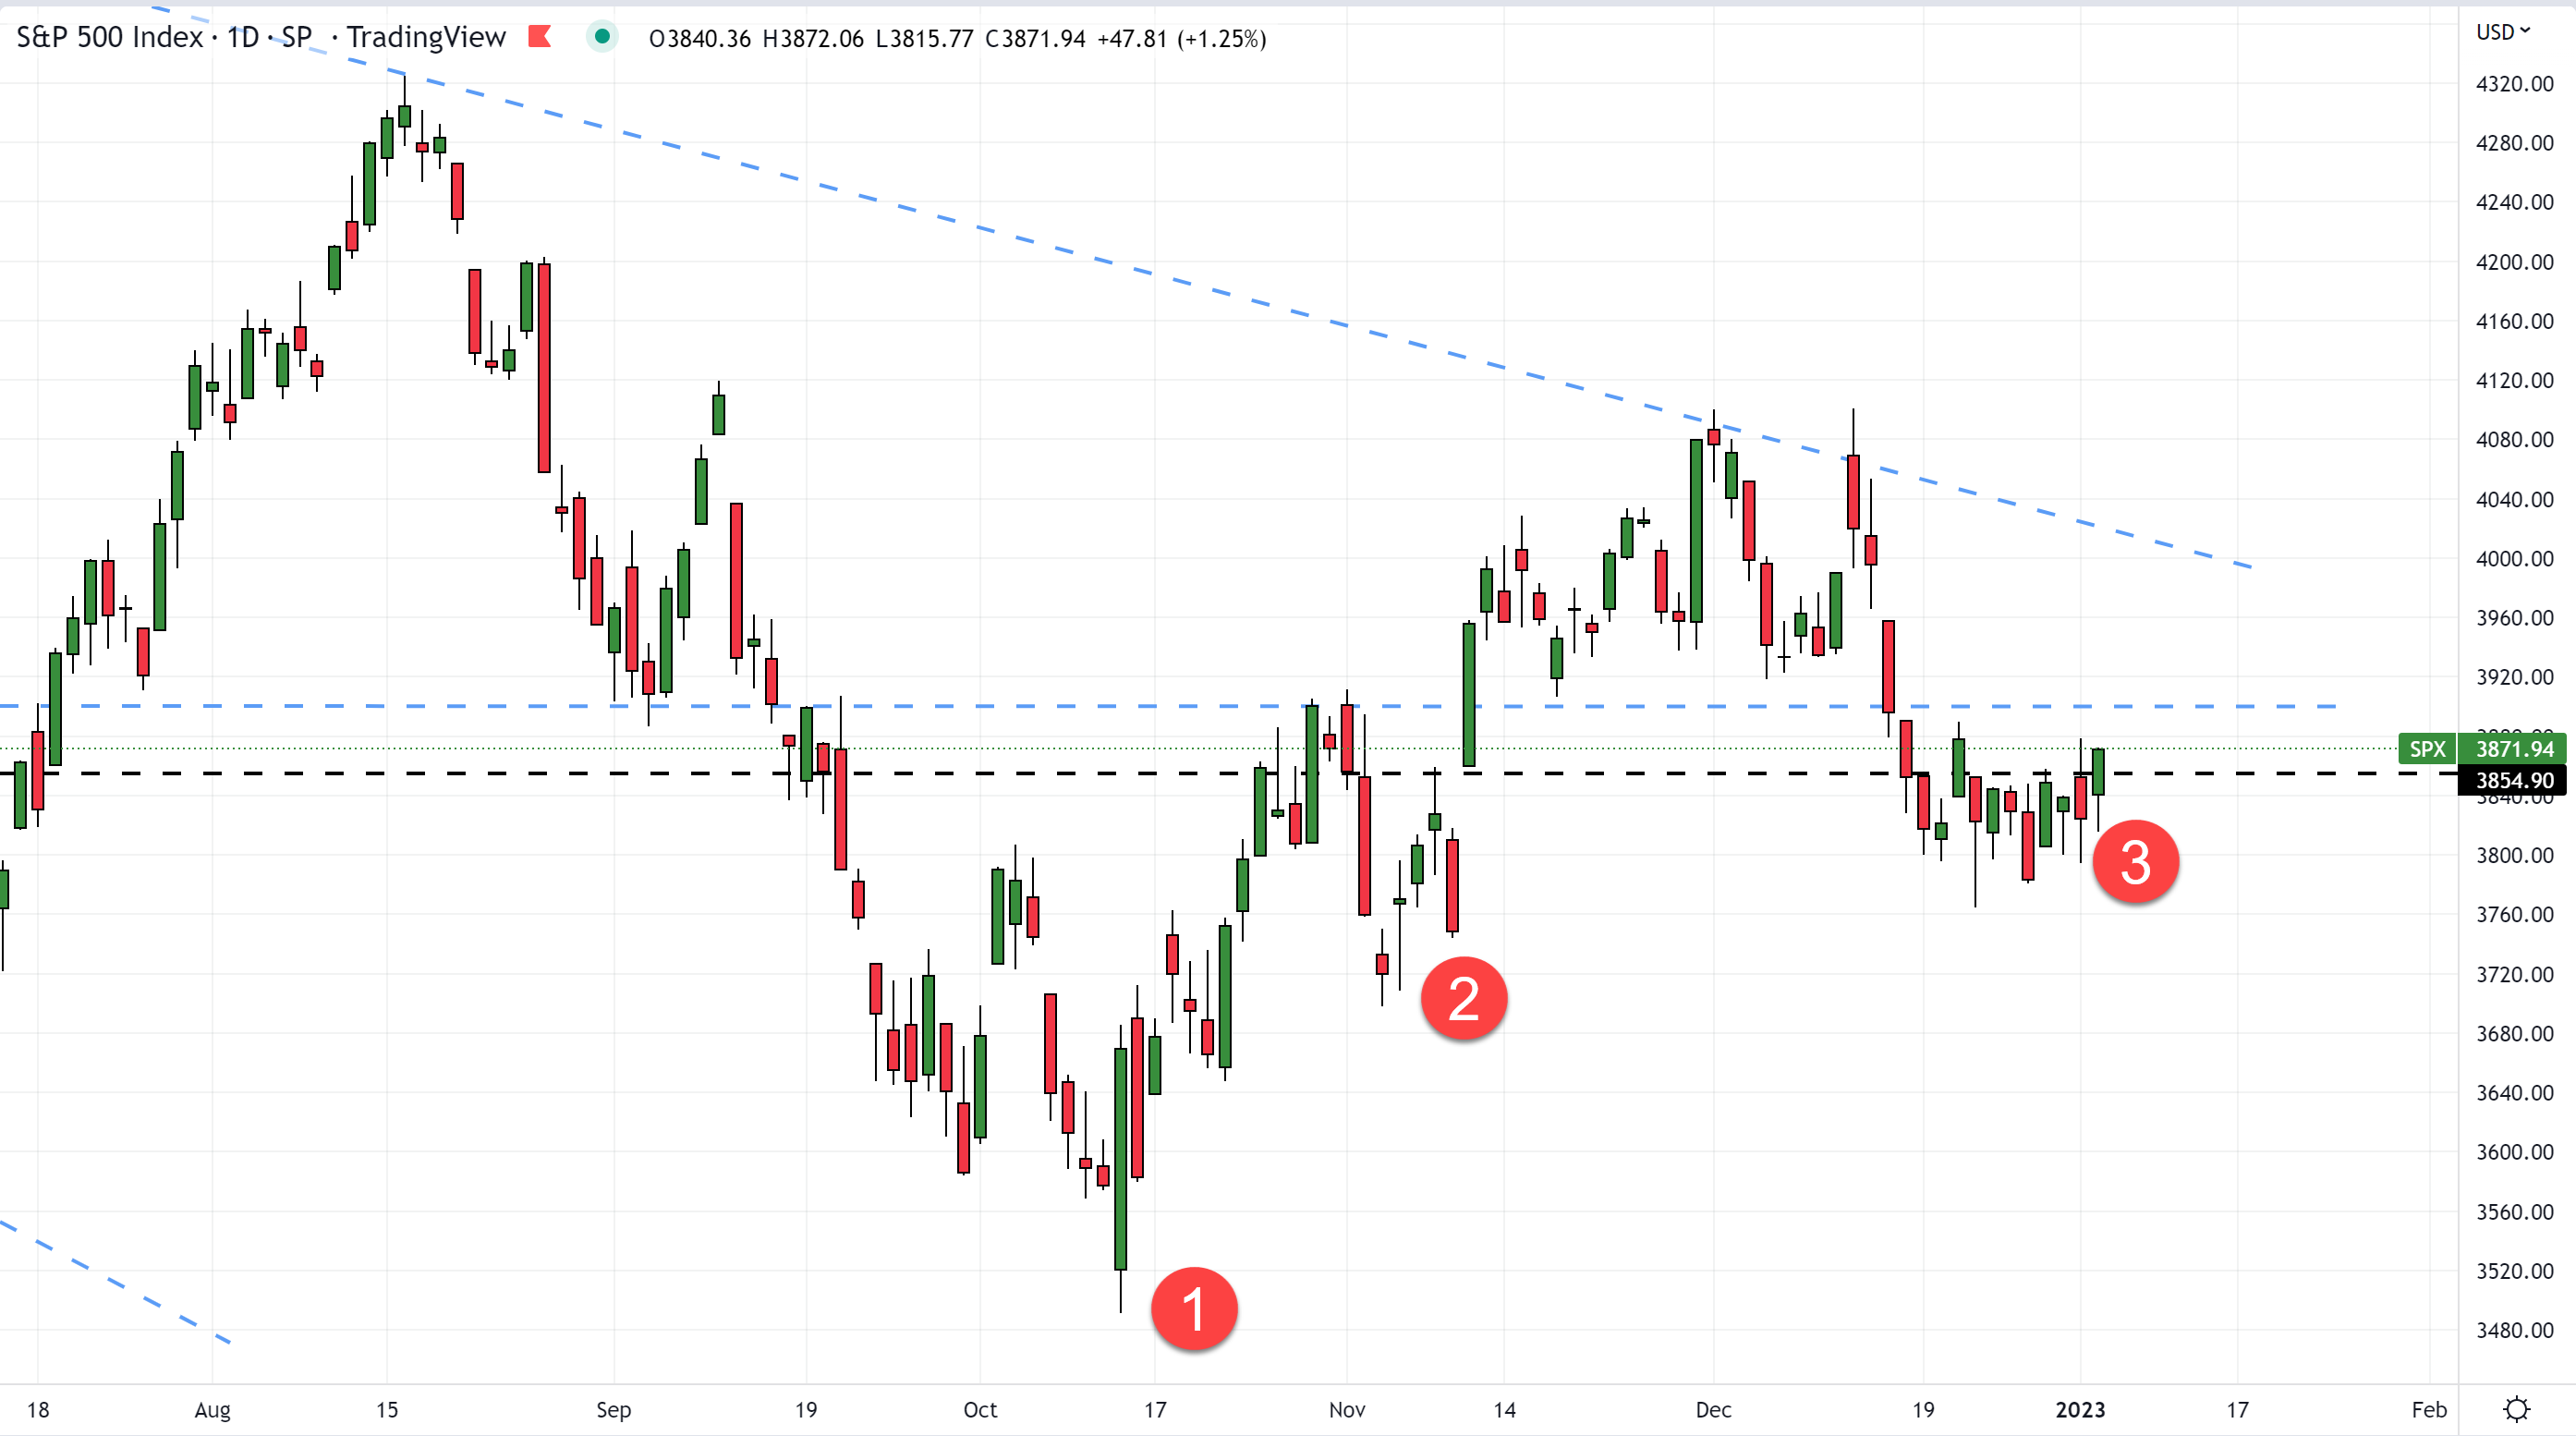
Fig. 2 – Daily Chart of S&P 500 (SPX)
Here’s how the relationship has played out since October…
- Mid-October
- The TNX jumped to a higher high of 4.3% for the first time since the Financial Crisis in 2008
- The SPX fell to a lower low at 3,500
- Early November
- The TNX established a lower high at 4.2%
- The SPX established a higher low at 3,700
- Now (Early January)
- The TNX has hit resistance at 3.9% and has pulled back to 3.7%
- The SPX has found support at 3,800 and is climbing back above 3,854.90
Where the TNX and SPX go from here will depend on Wall Street’s expectations for the Fed, because…
- If Wall Street starts to anticipate more interest-rate hikes from the Fed during 2023, the TNX will likely climb, and the SPX will likely fall.
- But if Wall Street starts to anticipate fewer interest-rate hikes from the Fed during 2023, the TNX will likely fall, and the SPX will likely climb.
So, what’s going to drive Wall Street’s expectations? Economic announcements.
If Wall Street see signs the U.S. economy is contracting, they will expect fewer rate hikes from the Fed because signs of economic contraction are an indication the rate hikes that have already been made are having the desired effect.
For those who aren’t as familiar with these terms, an economic contraction refers to the downward slope of a business cycle – during which “the economy is producing fewer goods and services than it did before. When fewer goods and services are produced, fewer resources are used by firms – including labor.” (Definition provided by the Federal Reserve Bank of St. Louis.)
If Wall Street see signs the U.S. economy is expanding (or – at least – not contracting), they will expect more rate hikes from the Fed because signs of economic expansion are an indication the rate hikes that have already been made are not having the desired effect.
So far this week, we’re getting mixed messages, but that isn’t necessarily a bad thing.
We’ll keep you in the loop about which economic announcements are important and the effect they have on the market.
Until then, earnings season kicks off next week, with big financial firms like Bank of America Corp. (BAC
), JPMorgan Chase & Co. (JPM), Citigroup Inc. (C), Wells Fargo & Co. (WFC), The Goldman Sachs Group Inc. (GS), and more reporting.
These types of stocks usually set the tone for the rest of the season, so we’re anxious to see what lies ahead.
In the meantime, our little-known, cash-generating secret – that has a shocking 94.03% win rate for 2022 – is the best way, in our opinion, to make money in any market condition.
And we think you’ll agree.
But in order to get the most out of this strategy, you need to be okay making money off the reckless investing decisions of others.
And we know that might make some people uncomfortable.
But to be clear – you won’t force investors to make dumb mistakes… In fact, you won’t be involved in their decisions at all.
They’ll make these ill-advised choices completely on their own, and there will be PLENTY of opportunities to capitalize.
We’re talking about the chance to grab instant cash payouts like $2,102… $1,132… $3,810… even as high as $4,357.
Click here to get all the details.
Sincerely,
John and Wade