After slipping lower in early trading Thursday, stocks did a good job to turn positive in the afternoon. That’s particularly true following such a strong showing from the bulls on Wednesday. After the big moves, there are still plenty of setups showing themselves, so let’s look a few must-see stock charts.
Must-See Stock Charts #1: Apple
Click to Enlarge
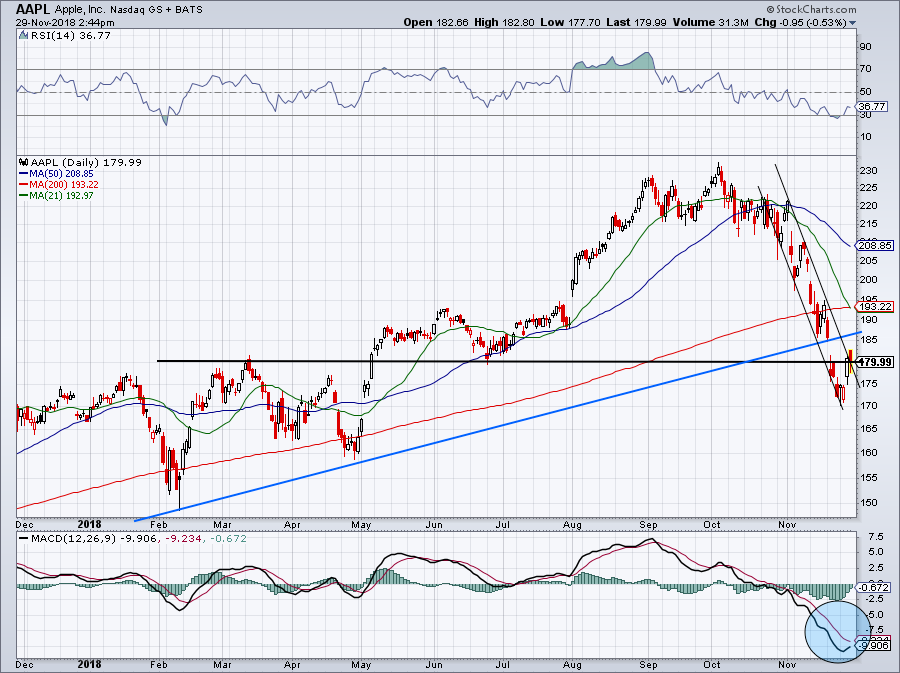
Let’s start with the biggest name out there, Apple (NASDAQ:AAPL). After being a beacon of hope for bulls through the October selloff, the share price collapsed in November, tumbling some $50 from high to low.
Since then, shares are breaking out of this sharp fall. For bulls, they’ll want to see Apple hold near this $180 level, fill the gap near $185 and hopefully get back above uptrend support (blue line).
Above that and we’ll see if Apple can get back above the 200-day moving average near $193. To do so, it may need some help from the broad markets. On the plus side, the MACD (blue circle) is starting to turn in bulls’ favor.
What they absolutely do not want to see at this point is a decline below the November lows.
Must-See Stock Charts #2: Facebook
Click to Enlarge
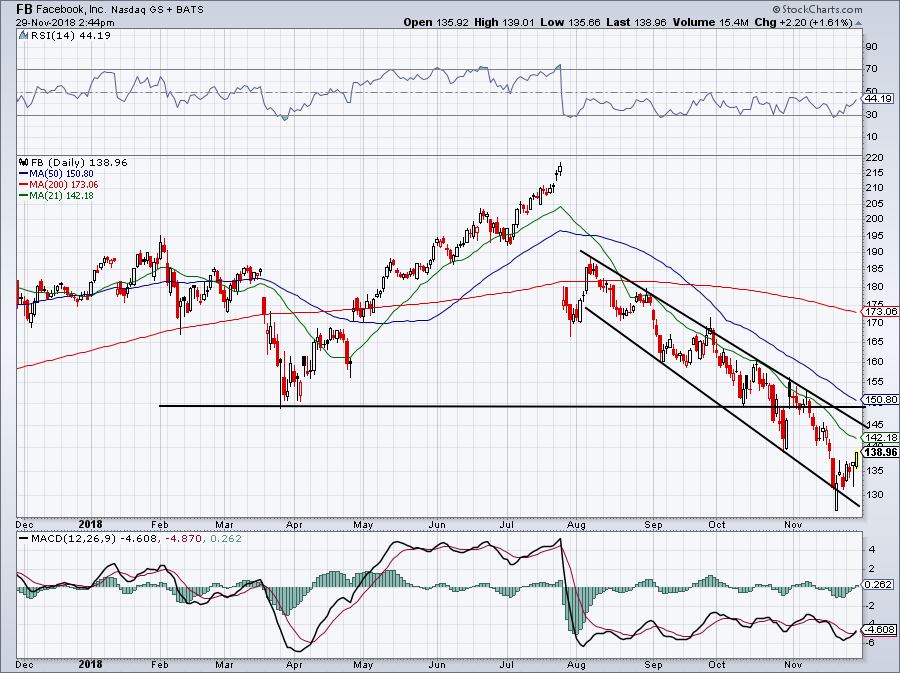
Shares of Facebook (NASDAQ:FB) are finally starting to trade better too, but the stock is far from out of the woods. In fact, once it lost its April lows, the play was to be bearish this name and it has paid off.
The 21-day moving average and downtrend resistance continue to weigh on FB. Bears may consider shorting this name on a retest of these levels. If FB can clear these hurdles, look for a run up to the 50-day moving average or the $150 level, whichever comes first.
If it does get to $150, that level was support from back in April. I’d expect it to act as resistance — at least on its first test.
Must-See Stock Charts #3: Box

Click to Enlarge
I’ve long liked Box (NASDAQ:BOX
) for its small market cap, (sub-$3 billion), dependable growth and reasonable valuation compared to its peers. The market hasn’t felt the same way, at least in the second half of 2018.
Shares have fallen almost 50% from peak to trough and while earnings usually aren’t a bullish catalyst for Box, they are helping to push the stock marginally higher Thursday. Finally back above the 21-day moving average and $18, let’s see if BOX can hold above these levels. If not, it could revisit its lows just below $15. Keep in mind, this stock went from $24 in September to $16 earlier this month.
I expect $20 to give Box an issue, while the falling 50-day moving average can weigh on it as well. So what’s the play?
Traders can stay long BOX over Thursday’s lows (or the 21-day, for more conservative traders) and look for a push up to the $20 level or 50-day moving average. If shares pull back, investors can buy a dip down to $16.
Must-See Stock Charts #4: Abercrombie
Click to Enlarge
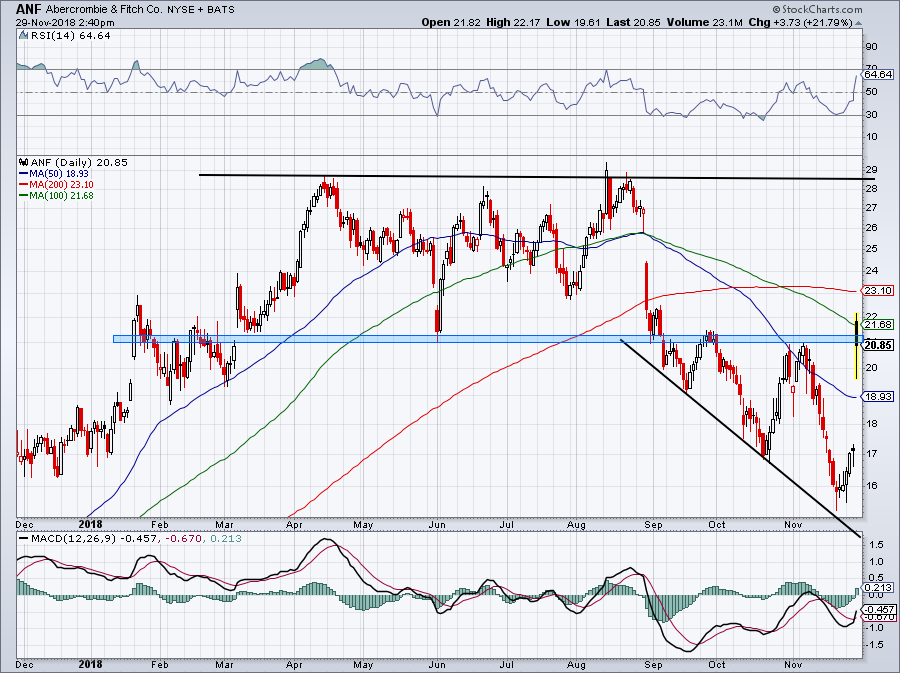
Shares of Abercrombie & Fitch (NYSE:ANF) are soaring 20% after the company reported earnings.
As it stands, the 100-day moving average is acting as resistance and ANF is failing to stay over that ~$21 level. Investors can buy on a pullback to the 50-day moving average if it holds as support.
If it continues to rally, either use Thursday’s low as the stop-loss or the $21 level if it can get meaningfully above it. This may apply best for bulls who were already long, given that ANF is up 20% on the day. On a further rally, look to see how ANF does at the 200-day.
Must-See Stock Charts #5: Jack in the Box
Click to Enlarge
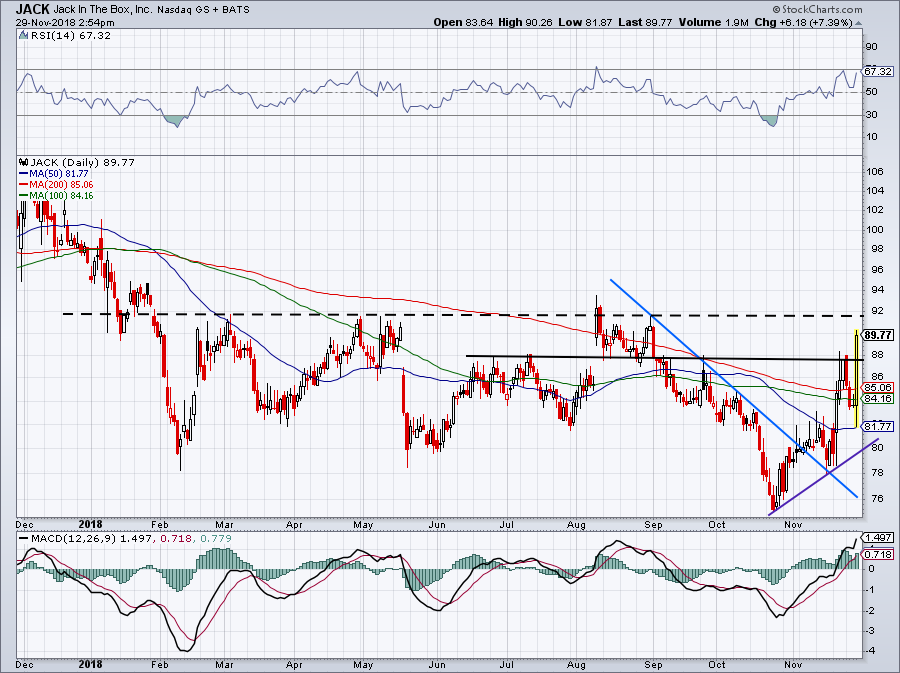
Shares of Jack in the Box (NASDAQ:JACK) are on the move, rising more than 7% after the company is reportedly exploring a sale and comes after a big earnings beat earlier this month.
The stock has been moving nicely off its November lows and with Thursday’s fall-and-rally, we saw JACK test its 50-day moving average before reversing higher and accelerating through its 100- and 200-day moving averages. That’s great price action.
Below $88 and we likely get a pullback into moving average support, which aggressive bulls will likely want to buy. Above and we can get a push up to $92. As tempting as a sale would be near this level, I don’t want to short into a possible buyout situation. While a pullback to uptrend support (purple line) would be attractive, it’s unclear if it will happen.
Bret Kenwell is the manager and author of Future Blue Chips and is on Twitter @BretKenwell. As of this writing, Bret Kenwell is long AAPL and BOX.