The recovery rally took a break on Friday — not a big one, but a well-deserved one. Even with Friday’s 0.12% dip from the S&P 500, it managed to log a 2.86% gain for the week. It’s a start, though the bulls still have more work to do.
Some names were still able to end the day well into the black. General Electric (NYSE:GE) was a particularly strong performer, up 3.3% for no particular reason other than investors continue to increasingly see the glass as half-full rather than half-empty. Snap (NYSE:SNAP) was a much bigger, even if less consequential, winner though, gaining 6.6% after hitting a record late last week. Like GE, traders are starting to think matters can only get better for Snap.
As for the losers, Sears Holdings (OTCMKTS:SHLDQ) was the most noteworthy. Shares of the bankrupt retailer were off to the tune of 2.2% during Friday’s regular-hours session, but after no bidder put in an offer to buy the company before the 4 p.m. deadline, the stock fell another 5.9% in after-hours action.
The indecisive end to the week as well as the calendar could make trading tricky to navigate today. Stock charts of CenterPoint Energy (NYSE:CNP), Dollar Tree (NASDAQ:DLTR) and Oracle (NYSE:ORCL
) are the best bets, as they’ve worked their way into technical conditions that point those stocks in a particular direction. Here’s how.
Dollar Tree (DLTR)

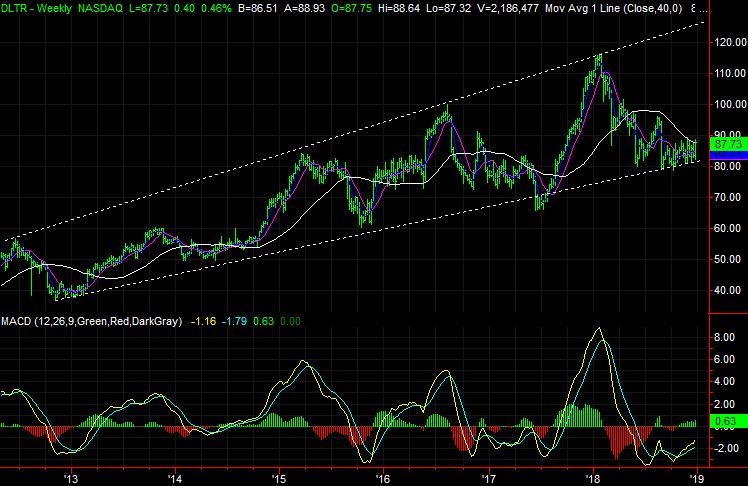
A couple of weeks ago, it was noted that Dollar Tree was range-bound but trending higher after pushing up and off the lower boundary of that range. That effort faded before reaching the upper edge of the range, though. In fact, DLTR peeled all the way back to the floor again early last week.
Right on cue, though, the stock bounced up and off that floor again. It’s en route to the upper boundary, though on Friday it hit the mother of all technical ceilings.
Click to Enlarge
• The near-term trading range is plotted with white dashed lines on the daily chart, though zooming out to a weekly chart we can see there’s a much bigger-picture trading range in play. The upper boundary of that range is currently around $126.
Oracle (ORCL)
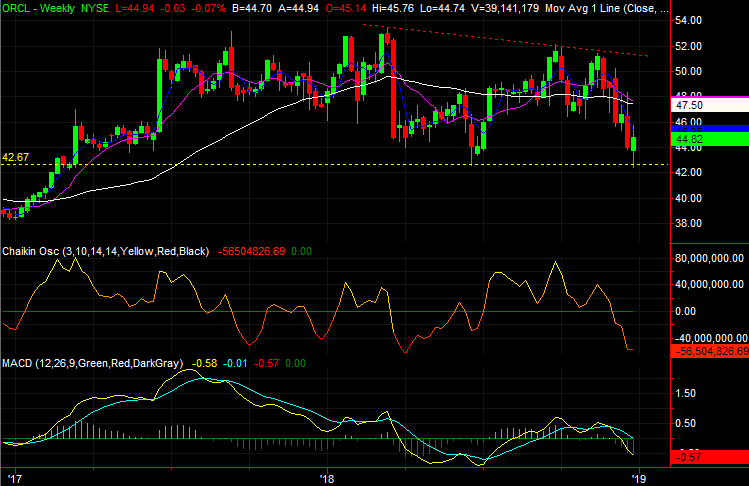
With nothing more than a quick glance, it doesn’t look like Oracle shares are doing anything other than experiencing the same kind of volatility most other stocks are dishing out. But, there may be more in play here than mere market influence. A careful inspection of the daily chart suggests the stock is struggling more than it seems.
There’s one last line in the sand the bears will need to cross, however, before the selling spirals out of control.
Click to Enlarge
• Underscoring the still-bearish undertow is the amount of selling volume seen on Friday, and the previous Friday, and the limited amount of buying volume seen in Wednesday and Thursday.
• It’s a last-ditch support level, but until this year’s key low around $42.66 is broken, the stock will have a fighting chance at recovering without suffering a major breakdown.
CenterPoint Energy (CNP)
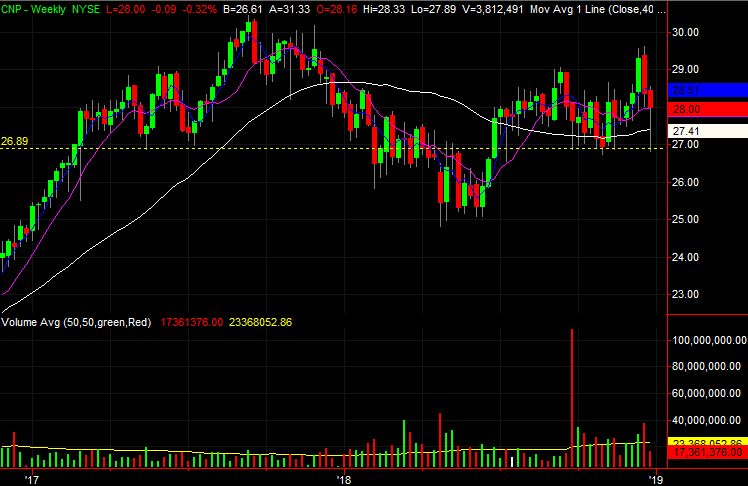
Finally, add CenterPoint Energy to the list of names that are knocking on the door of a breakout thrust. The bulls have drawn a strong support line from which the stock can push off, and CNP shares are using it. There’s just one more key technical hurdle to clear before the advance becomes much more fluid.
Click to Enlarge
• Although CNP only looks like a choppy mess right now, there’s more working in favor of the stock than it seems. The white 200-day moving average line is sloped upward, and two of the three other important moving averages are also pointed upward. It’s a sign that the bigger-picture undertow is bullish.
• The last hurdle to clear is the blue 20-day moving average line, currently at $28.34. Friday’s gain was stopped and sent lower from that level.
As of this writing, James Brumley did not hold a position in any of the aforementioned securities. You can follow him on Twitter, at @jbrumley.