Monday’s reversal rally spilled into Tuesday, leading to early gains for overnight holders. However the early morning rally eventually faded and before bulls were able to push markets higher near the close. It’s a big move in just two days, but if they can keep pushing to the upside, perhaps they can gain some momentum. In the meantime, here are a few must-see stock charts.
Must-See Stock Charts for Tomorrow #1: Nasdaq ETF
Click to Enlarge
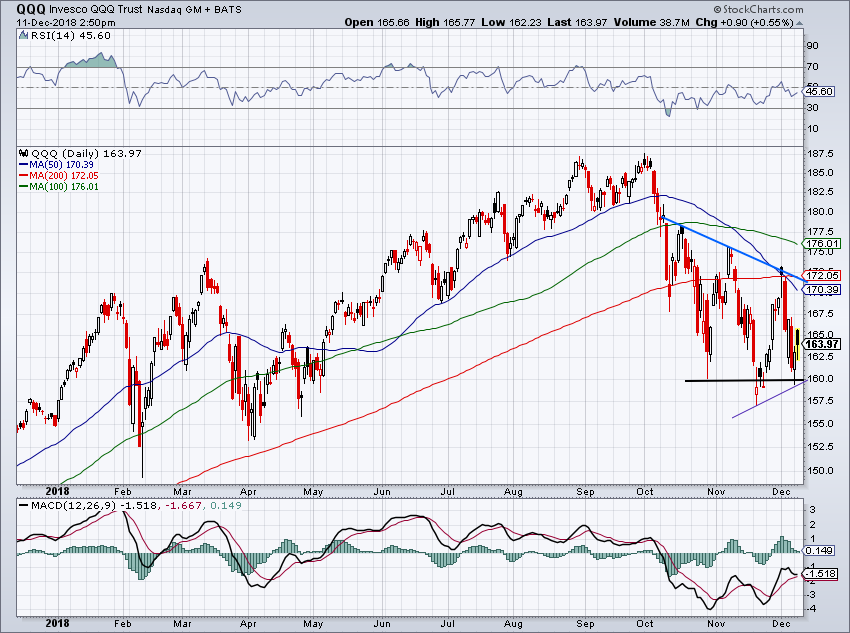
Let’s start with the PowerShares QQQ ETF (NASDAQ:QQQ), an ETF that closely mirrors the Nasdaq index.
After a strong reversal on Monday and some continuation on Tuesday, the QQQ has gained some bullish momentum. But let’s not forget, this isn’t a trusty market right now. It’s encouraging that it put in a lower high (purple line) and the $160 mark held as support.
But it still has a tough fight ahead of it if it really wants to get back to its bullish ways. It will take plenty of chop to get it done, but the QQQ will eventually need to get through downtrend resistance (blue line), which also coincides with the 50-day and 200-day moving averages.
Must-See Stock Charts for Tomorrow #2: Square
Click to Enlarge
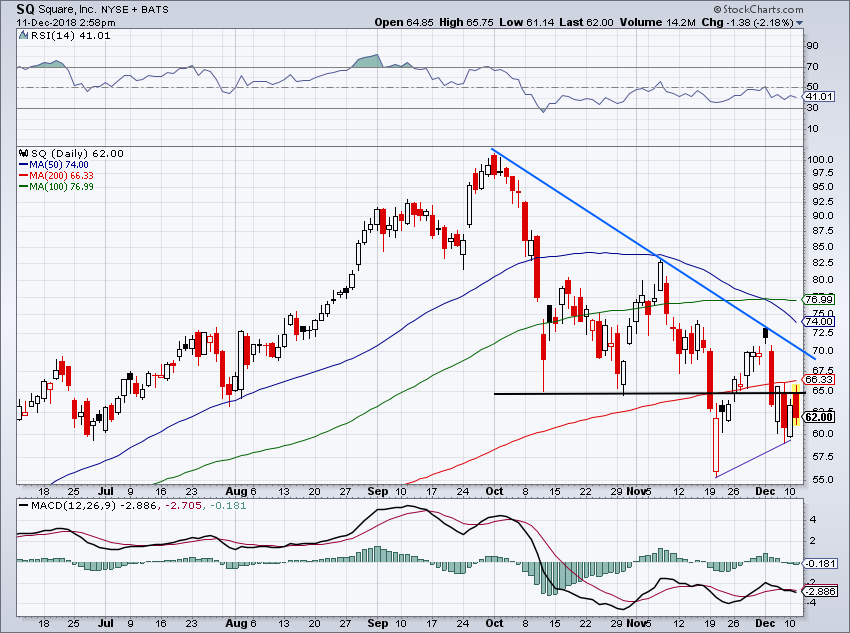
Like the QQQ, Square (NYSE:SQ) is putting in a lower high, but support did not hold near $65. While not catastrophic, I can’t help but feel SQ stock is setting up as a strong short candidate.
There’s prior support at $65, the 200-day moving average at $66 and downtrend resistance (the strongest of them all) at $67. Bears will need a bit more of a rally still, but there’s a great risk/reward short trade setting up in Square.
Must-See Stock Charts for Tomorrow #3: Stitch Fix
Click to Enlarge
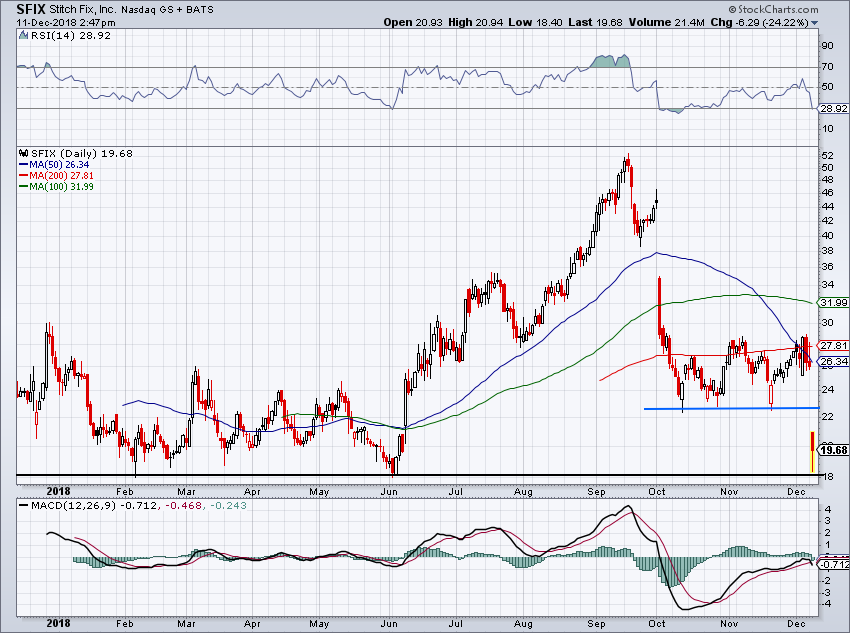
Shares of Stitch Fix (NASDAQ:SFIX) are plunging after the company
reported its fourth-quarter results. That comes as little surprise given what we saw in the company’s third-quarter results and given the current market climate. Either way, the stock is down 23% Tuesday. Now what?
Those who feel compelled to play SFIX, use $18 as your barometer. Longs can stay with it above that mark, while bears can push it lower should it break. If it holds, look for a rally back to the $22 to $23 level. If SFIX can’t breakout, bulls should ring the register and bears should look to sell-short.
Must-See Stock Charts for Tomorrow #4: Roku
Click to Enlarge
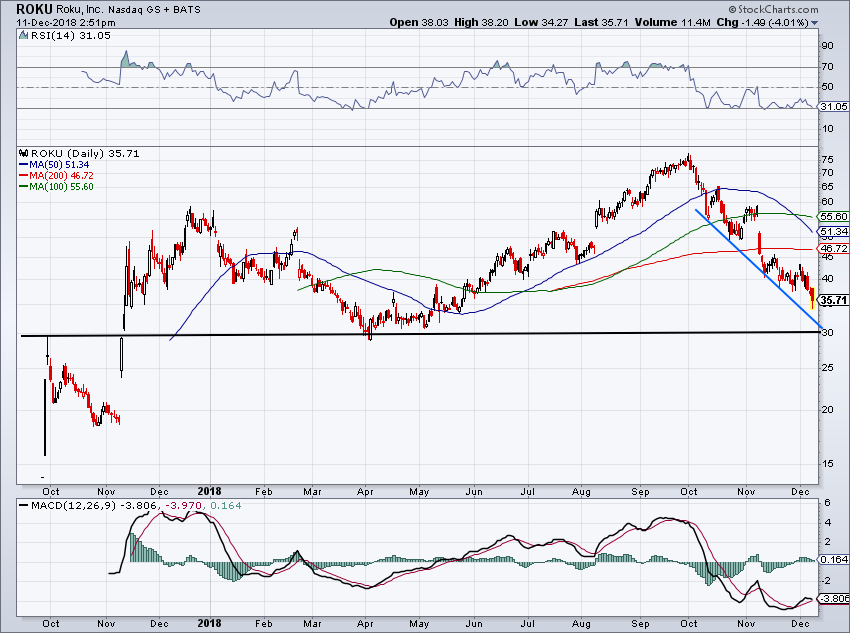
Reports of a restructuring for TCL hit shares of Roku (NASDAQ:ROKU) on Tuesday, which fell about 5%. While admittedly under short-term pressure, I really like the long-term story here — it’s a lot more than a streaming stick.
In any regard, the stock has plunged into no man’s land, with only a cascade of selling showing up as its main pattern. It could reverse here and go back to $50 for all we know. But if it continues lower, traders and investors may want to give it a shot near $30.
This level has been significant over the years and it will market a decline of more than 60% from its highs 10 weeks ago. Think about that for a minute, especially coming off a quarter that management beat and raised its estimates on.
Must-See Stock Charts for Tomorrow #5: DSW Inc.
Click to Enlarge
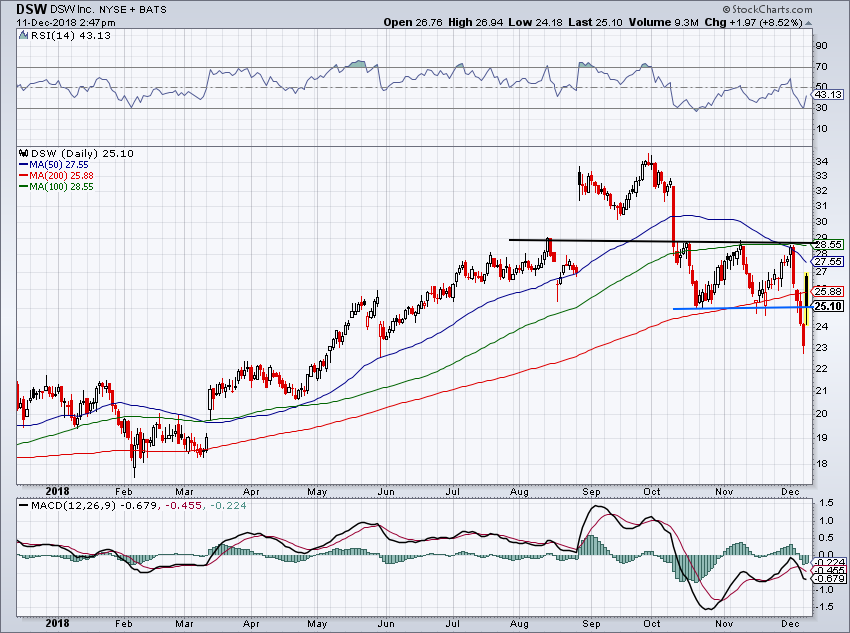
Unlike SFIX, DSW Inc. (NYSE:DSW) shares are rallying more than 8% after the company beat on earnings and revenue expectations.
Unfortunately, Tuesday’s big rally wasn’t enough to keep DSW over its 200-day moving average. That’s telling me that DSW investors lack conviction and that the 200-day may now be resistance. Of course, DSW could prove me wrong over the next few sessions and it would be welcoming. It would give us a level to measure against, because as of now, there’s not a great setup on the chart.
Below $25 and the December lows are back in play. If we get over $25 and the 200-day, then the $28 level is in on the table, provided DSW can get through the 50-day moving average.
I want investors that do their homework and pick good stocks to be rewarded when the company does well. That validates their thesis and gives them conviction and confidence. Short-term investors can make their play based on how DSW handles $25, but I need to see more before getting involved with DSW.
Bret Kenwell is the manager and author of Future Blue Chips and is on Twitter @BretKenwell. As of this writing, Bret Kenwell is long ROKU.