
The market couldn’t even give bulls a Merry Christmas gift, with stocks shedding even more value on the holiday-shortened trading session on Christmas Eve. The Dow Jones fell over 600 points and the S&P 500 dropped almost 3%. It’s been a December to remember, that’s for sure. Let’s look at a few must-see stock charts for those who will be ready on Wednesday morning.
Top Stock Trades for Wednesday #1: Utilities
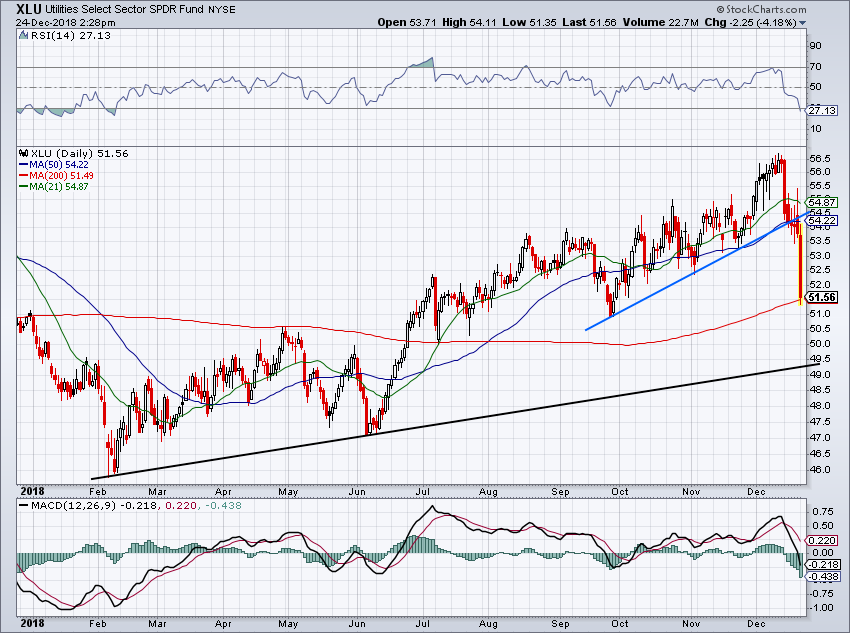
Click to Enlarge
Known as the defensive sector, these stocks typically do well amid recessions and bear markets. However, those hiding out in the Utilities SPDR (NYSEARCA:XLU) were awoken with a 4.2% pummeling on Monday. Now what?
The signs showed up a few days ago, after short-term uptrend support (blue line) gave way. It wasn’t a violent breakdown, just a casual close below, while the XLU also fell below its 50-day moving average. Then on Monday it dropped precipitously.
Now holding up at the 200-day moving average, investors will be searching for direction come Wednesday. Do we see more downside, perhaps down to its long-term uptrend support (black line) or do we get a recovery? If it’s the latter, look for an eventual retest of prior uptrend support and the 50-day moving average.
Top Stock Trades for Wednesday #2: AT&T

Click to Enlarge
Speaking of the normal defensive stocks, AT&T (NYSE:T) is typically one of them. However, that hasn’t been the case in Q4 2018.
Falling over 3% on Monday, T stock just broke below what I considered a vital level at $29. It may very well lead AT&T down to $27, just three-dozen pennies from current levels.
However, consider what you’re getting at these levels. AT&T is now yielding 7.5% per year after having just raised its dividend by 2% earlier this month. The company has not only paid but raised its dividend for 35 straight years and has the free cash flow to support it. As it stands, AT&T has a payout ratio of just 40%.
Further, T stock trades at less than 7.5 times this year’s earnings. It’s looking somewhat like a value trap, but if you’re buying for income and want a little potential upside, AT&T may be worth your time.
Top Stock Trades for Wednesday #3: S&P 500 ETF
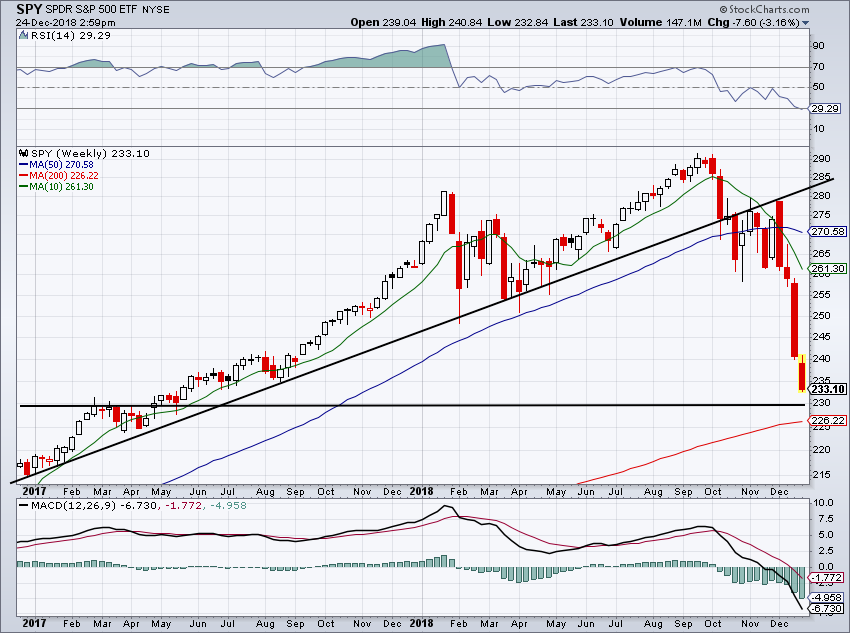
Click to Enlarge
When can we get some reprieve? With the SPDR S&P 500 ETF (NYSEARCA:
SPY) down four weeks in a row and eight straight sessions some sort of dead cat bounce is due up soon.
At some point the selling has to let up, even if just temporarily. The economy is not in a free-fall and we’re not in the midst of another Great Recession. But we are working against the Fed, still have a lot of work to do before repairing our relationship with China and have a government that seems more than happy to function in total disarray.
Breaking below the uptrend is obvious now as the SPY has been in full-blown crater mode — the SPY is down 18.5% for the quarter. At some point, we need a snap-back, even if it’s just a temporary rally.
On the weekly chart, that could come into play somewhere between $225 and $230. This was a notable level in 2017 and it’s also where the 200-week moving average currently rests. Let’s see what the rest of this week’s action looks like.
Top Stock Trades for Wednesday #4: Broadcom

Click to Enlarge
I didn’t expect to see Broadcom (NASDAQ:AVGO) stock cool off so much. Earlier this month, the company reported a great earnings result, provided better-than-expected guidance, raised its dividend payout by 51% and trades at ~10 times earnings.
If others want to ignore it, then fine by me. But this is one that I’ll be adding to on a further decline into uptrend support. Those more aggressive can buy with moving-average support just below current prices. However, I wouldn’t go all in at once. Just remember this one has prodded sub-$210 more than once over the last six months. But I would love a shot around $220.
Top Stock Trades for Wednesday #5: Realty Income
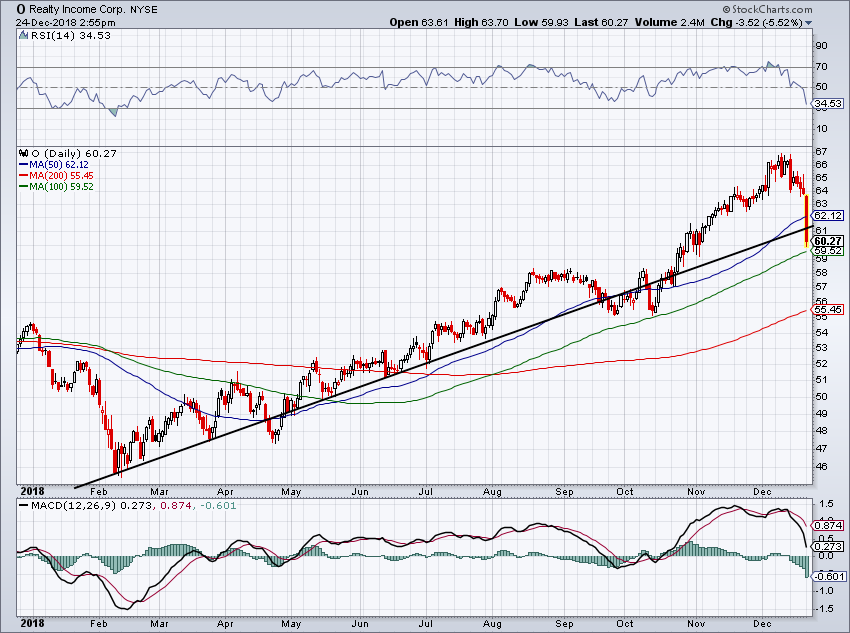
Click to Enlarge
So much for smooth-n-steady. Realty Income (NYSE:O) has been one of the best performers since February, but it was rocked on Monday. “The Monthly Dividend Company” saw its stock hammered 5.5% on the day and knife right through its 50-day moving average.
I would be a nibbler of this winner though, particularly as its perched right above its 100-day moving average. Now paying out 4.4% and down 10% from earlier this month, O is looking much more attractive. Just don’t go all-in at one price. Nibble until the tide shifts into your favor.
Bret Kenwell is the manager and author of Future Blue Chips and is on Twitter @BretKenwell. As of this writing, Bret Kenwell is long T and O.