
Friday’s lackluster start didn’t last until the closing bell rang. Though the S&P 500 still logged its first loss in six sessions on the last day of last week, the bulls pared the loss back to a mere 0.01%. Plus, the sellers never really came out in numbers.
General Motors (NYSE:GM) did its part to keep the broad market out of the red, gaining 7.1% after dishing out a 2019 profit outlook that exceeded expectations. Netflix (NASDAQ:NFLX) chipped in as well, advancing 4% after UBS upgraded the stock to a “Buy,” explaining investors now have more clarity about its challenges.
But, there were just a few too many names like Activision Blizzard (NASDAQ:ATVI) weighing stocks down. Although advancers outnumbers decliners on Friday, the decliners dished out big dips like the 9.4% tumble ATVI took after it was announced it was parting ways with one of its game development partners.
The weekend should clean the mental slate for most tickers, though the stock charts of Newmont Mining (NYSE:NEM), Masco (NYSE:MAS) and O’Reilly Automotive (NASDAQ:
ORLY) are already largely locked into a pattern that’s leading into something.
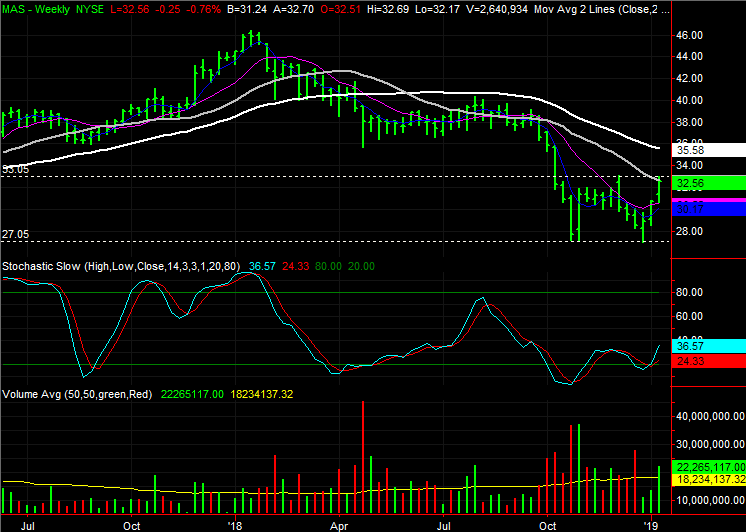
Masco (MAS)

The last time we looked at Masco back on Nov. 29, shares were knocking on the door of a break above technical resistance around $32. It ended up following through just a couple of days later, but to no avail. Shares reversed course the day after that, and spent the following month falling back to its previous low around $27.
That pullback ended up turning into a double-bottom though, and since the MAS has fought its way back above $27. The newest hurdle now stands just above $33, where Masco shares peaked the one day more than a month ago the ceiling at $27 was breached. Masco shares haven’t been able to break above that ceiling either, and another one’s since moved into the picture. If that resistance can be cleared, however, MAS could soar.
Click to Enlarge
• Also coming into the picture is the 100-day moving average line, plotted in gray. MAS neared that line last week, but traders are cautious about pushing past it.
• There has been a great deal of volume behind the recent upturn, however, suggesting there are buyers ready and willing to step in if it can break above the last technical resistance level.
Newmont Mining (NEM)
It has got more to do with rising gold prices than with the miner itself. But, for traders looking for a good way to plug into what’s quickly becoming an impressive rally, Newmont Mining may be the best of the best. The momentum is strong, and there’s only one more hurdle to clear.
What a hurdle it is though.

Click to Enlarge
• Guiding Newmont shares to and possibly beyond their 200-day average is a set of well-established support and resistance lines, plotted in yellow on both stock charts.
• Whatever support isn’t being provided by the lower edge of the rising trading range, the stock’s other key moving average lines are offering. The purple 50-day average line has been especially helpful.
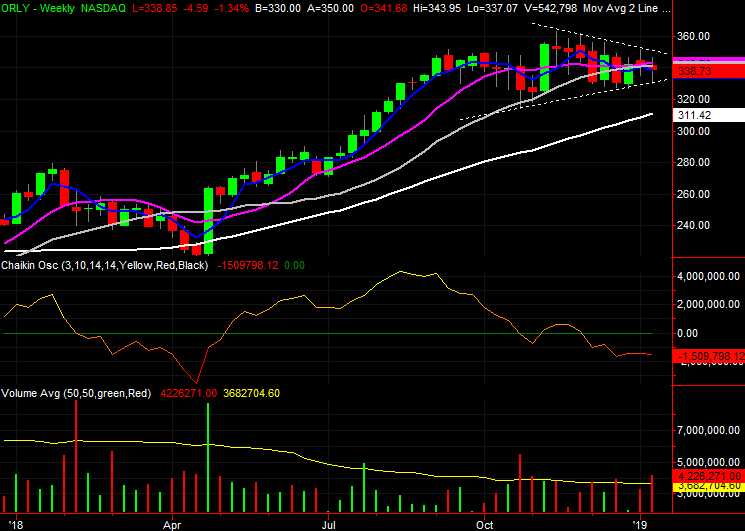
O’Reilly Automotive (ORLY)
Finally, it’s suspicious just how much O’Reilly Automotive has failed to participate in the recent market recovery. More than that though, a closer examination of the stock’s undertow suggests a pullback is brewing. One misstep could easily put a profit-tracking chain reaction in place.
Click to Enlarge
• The selling volume has also been heavy. It’s been so heavy, in fact, that the weekly chart’s Chaikin line has been below the zero mark for weeks. Though O’Reilly are holding their ground, a great number of traders are getting out.
• The trigger for any selling avalanche will most likely come in the form of a break below the lower edge of the recent support line, current at $331.
As of this writing, James Brumley did not hold a position in any of the aforementioned securities. You can follow him on Twitter, at @jbrumley.