
Shares of banking giant JPMorgan (NYSE:JPM), much like the broader stock market, had a turbulent time in 2018. Through the lens of technical analysis, JPM stock completed an intermediate-term topping process last year but in the near-term following its latest batch of earnings still looks to have some upside for a trade.
Before digging into this follow-up trade idea (initial trade idea to buy JPM HERE), allow me to reiterate the positive correlation among stocks as an asset class as well as within sectors and industry groups. While stocks are positively correlated to begin with, correlation tends to increase during market volatility. During earnings season, which we are currently going through, an entire sector or group of stocks can make quick moves in the same direction based on a stock’s earnings report and outlook. This is one of the main reasons why I always advocate a cautious trading approach through earnings reports.
JPM Stock Charts

Click to Enlarge
Moving averages legend: red – 200 week, blue – 100 week, yellow – 50 week
In terms of JPM stock, as we will see on the daily chart, while there still is a bullish “counter-trend” trade in place, a plethora of other banking stocks are just about to report earnings. Any negative news out of those names and JPM stock too could quickly rotate back lower.
As a reminder and to regain perspective on JPM stock as to where it stands in the bigger picture, let’s first take a gander at the multiyear chart.
Here we see that after ascending in an orderly uptrend for years, in late 2016 a breakout occurred that ultimately squeezed the stock into its 2018 highs. Because gravity ultimately also applies to the stock market, JPM stock in Q4 of 2018 mean-reverted back to the upper end of the longer-standing channel (blue parallels). In my eye, this stock has its work cut out through a multiquarter lens at least and ultimately will see gravitation lower again.
Click to Enlarge
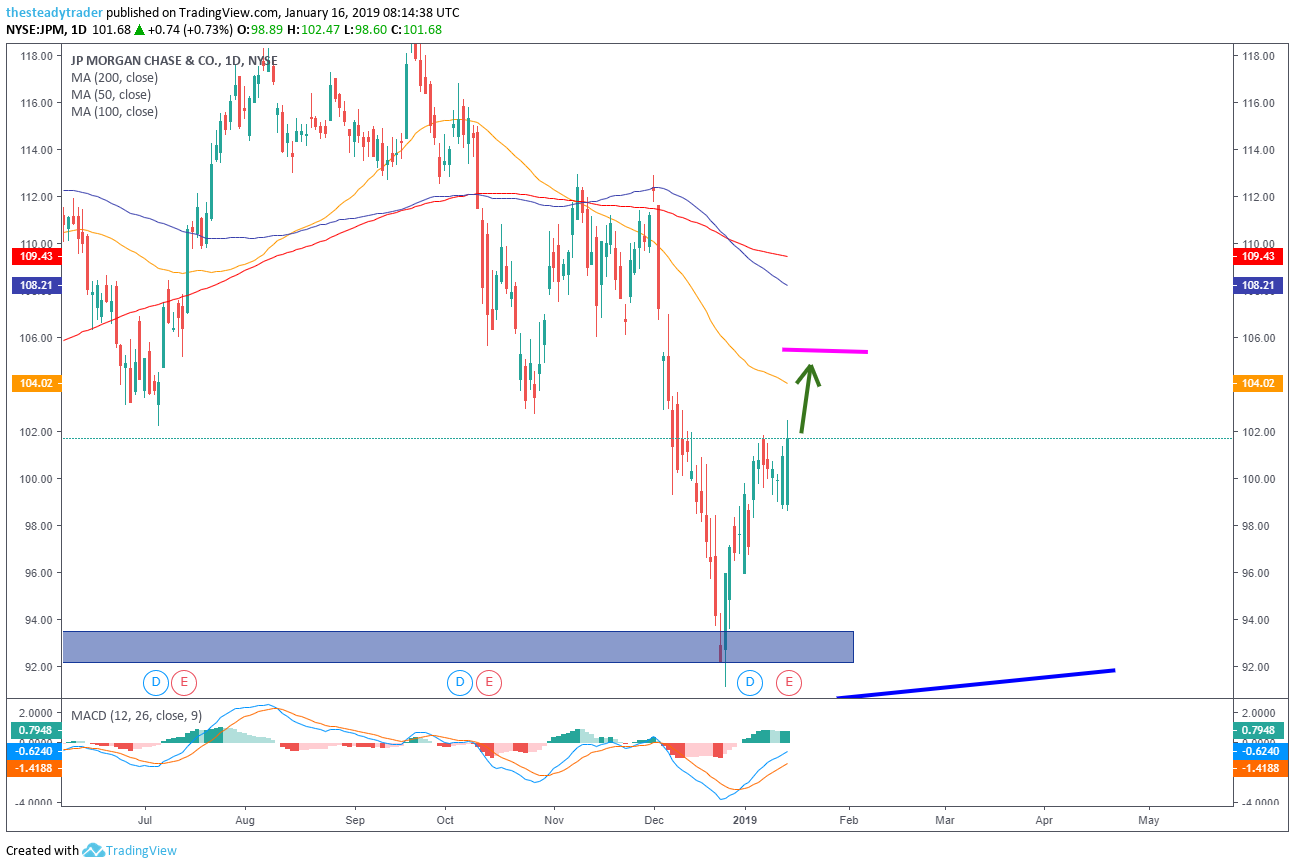
Moving averages legend: red – 200 day, blue – 100 day, yellow – 50 day
On the daily chart, we see that JPM stock bounced sharply off its late 2018 lows, then consolidated and, after its latest earnings report on Jan. 15, gave us a bullish reversal day with one of my proprietary B2 Reversal Buy signals. This move now suggests the stock is ripe to make its way higher toward the $105-$106 area.
Through the lens of risk management, I do, however, want to reiterate that we are currently in bank earnings season and that any negative (perceived) news out of any other major banking stocks could quickly stop this rally in JPM stock as well. A stop-loss at $98 make sense for this near-term bullish trade setup.
Get FREE ACCESS to Serge’s renowned Stock Market Scanner with actionable trade ideas. Get it HERE.