
U.S. stocks — and global risk assets for that matter — did end up seeing a bounce into the end of 2018, but one that still leaves much left to be desired for by the bulls. While I foresee plenty of volatility ahead in 2019, for the here and now, some stocks such as that of JPMorgan (NYSE:JPM) have reached oversold levels where there’s a good probability of bounces.
Before looking at a couple of crucial charts of JPM stock, allow me to say an important word in stock market correlation. I always stress that risk assets are positively correlated, particularly during “risk-off” periods such as we have seen over the past couple of months and indeed throughout much of the second half of 2018. In other words, investors trying to hide out in one pocket of the stock market during a volatility spike on average (and depending on the severity of the the volatility) tend to be disappointed with their returns. In other words, when larger investors or algorithms hit the sell button, most risk assets will go down together.
To be clear, risk assets also tend to correlate on the way up … but where investors tend to get surprised the most is on the way down.
JPM Stock Charts
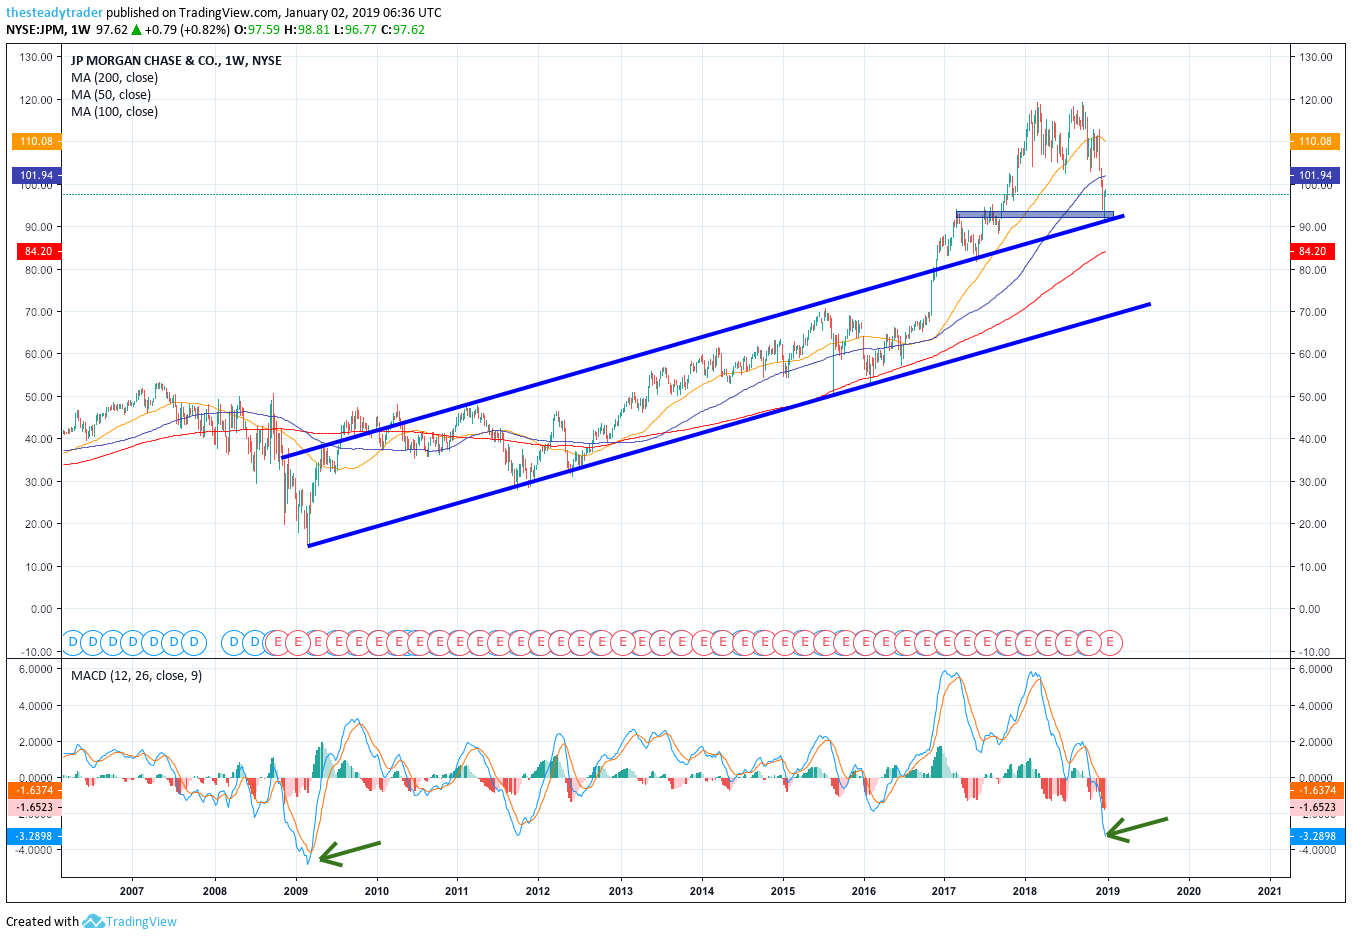
Click to Enlarge
Moving averages legend: red – 200 week, blue – 100 week, yellow – 50 week
Looking at a multiyear chart with weekly increments, we see that JPM stock in 2018 was subject to plenty of volatility and mean-reversion (lower). As I often discuss, when stocks overshoot their longer-standing up-trends they ultimately tend to mean-revert back to those trends. That is not only what began to transpire for JPM stock in 2018 but indeed for much of the broader U.S. stock market.
As a result of the mean-reversion move, note that on a weekly closing basis JPM stock now has its MACD momentum oscillator at the bottom of the chart at its most oversold since 2009. While that does not mean that stock cannot succumb to further selling pressure, in my eye the rate of change lower for the time being is likely exhausted.
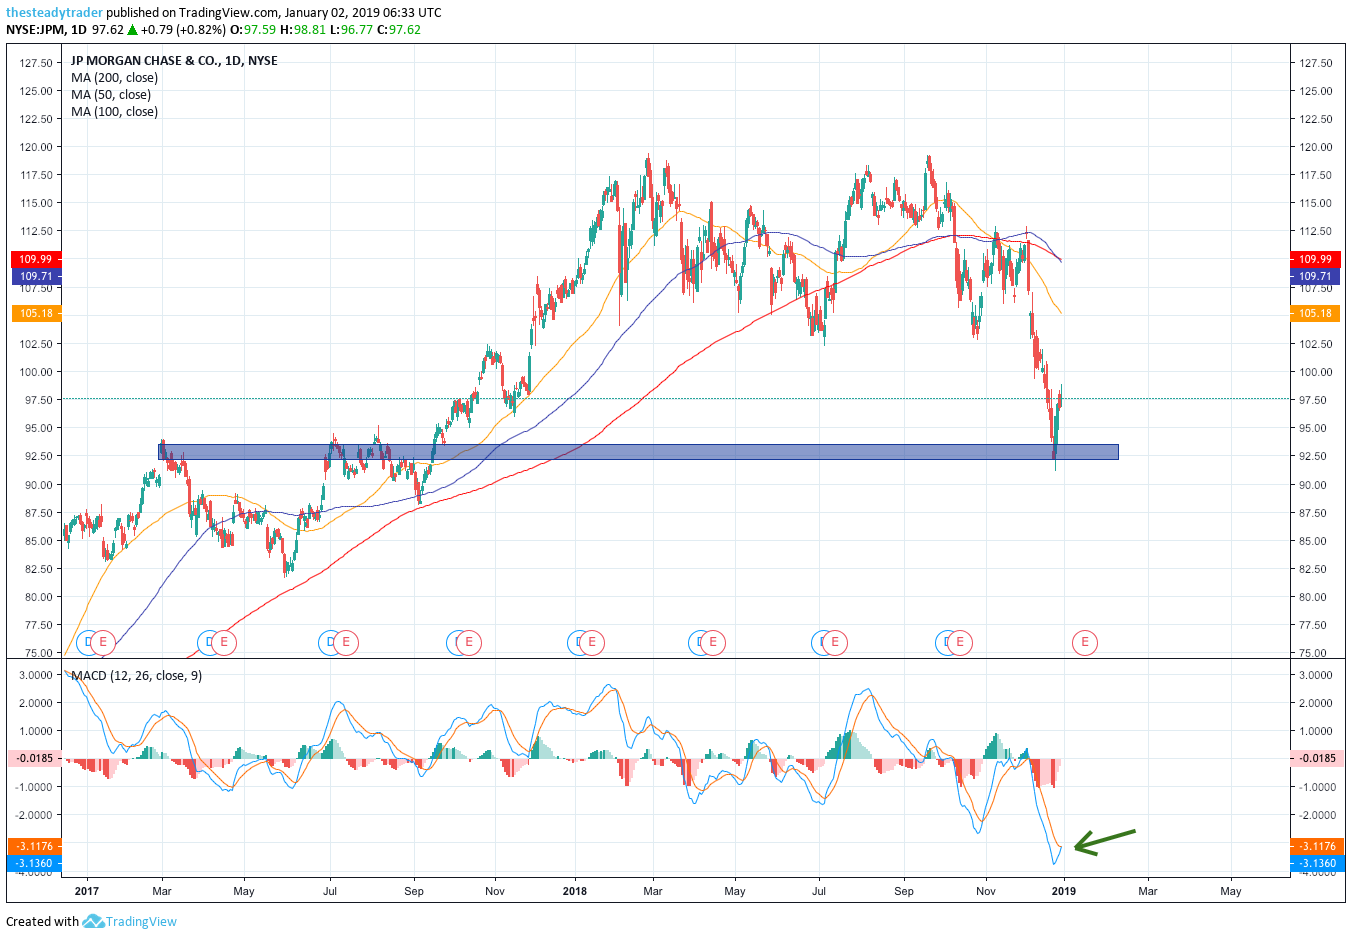
Click to Enlarge
Moving averages legend: red – 200 day, blue – 100 day, yellow – 50 day
On the daily chart, we see that the stock’s nearly 20% drop from early December into the Christmas holiday forced it to bounce off simple horizontal support around the low $90’s, where a year-end bounce occurred from. In my eye this support area in the low to mid $90’s is as good a spot as any to leg into some long-side exposure for a trade.
JPMorgan is set to report its next batch of earnings on Jan. 15 before the market open, which is to say that traders must circle that date as a day when the stock could see an outsized move in either direction.
Either way, reward to risk in the low-to-mid $90s for a move higher toward $106-ish in my eye is good. Traders could use a stop loss at $90.
Get FREE ACCESS to Serge’s renowned Stock Market Scanner with actionable trade ideas. Get it HERE.