Building on Wednesday’s intraday bounce out of deep trouble to only modest trouble, the bulls mustered another winning session on Thursday. The S&P 500 gained 0.36% yesterday, not driving a high above Wednesday’s peak, but at least keeping the market above its 20-day moving average line.
 Lululemon Athletica (NASDAQ:LULU) led the way with its 14.1% pop following the release of surprisingly strong fourth-quarter numbers that were underscored by an expansion of its men’s lineup. Verint Systems (NASDAQ:VRNT) fared slightly better though, in response a fourth-quarter earnings beat and very encouraging guidance.
Nielsen Holdings (NYSE:NLSN) was at the other end of the spectrum, falling 11.2% on reports that Blackstone was no longer bidding on the ratings company that’s been “for sale” for some time now.
Headed into the last trading day of the week, the stock charts of Fidelity National Information Services (NYSE:FIS), Discovery Communications (NASDAQ:DISCA) and Kimco Realty (NYSE:KIM
) are worth the closest technical looks. Here’s why.
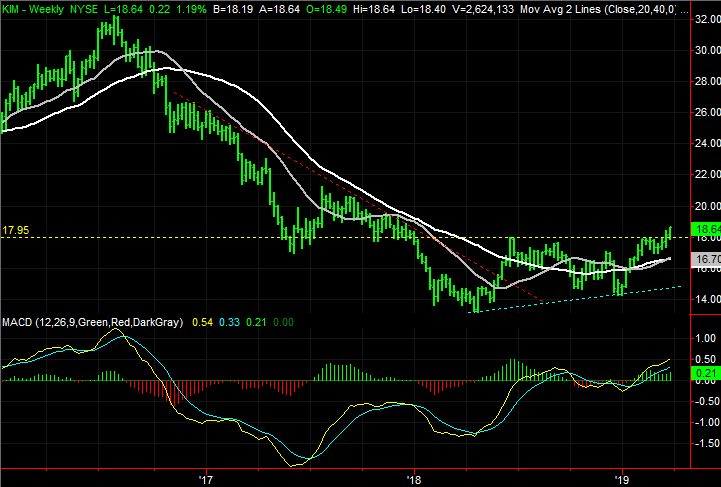
Kimco Realty (KIM)
Back on Feb. 11, Kimco Realty was featured as a budding breakout candidate. Shares were testing a previous key peak, and that advance was taking shape on above-average volume.
That hint didn’t pan out … at least not initially. Instead, the stock peeled back a bit. The second wind that has materialized this month, however, has gotten KIM past that hurdle. Although it’s back to being a little overextended, there’s a great deal of room to regain ahead, and good reason to think Kimco shares will do so.
Click to Enlarge
• The weekly chart puts matters in perspective. This stock was hammered between 2016 and 2017, but since 2018 has been logging higher highs and higher lows. Yet, most of what was lost has yet to be reclaimed.
• The bullish divergence of the moving average lines on the daily chart (highlighted) is compelling, but with shares now 12.6% above the white 200-day moving average line, the divergence may have reached somewhat unhealthy levels.
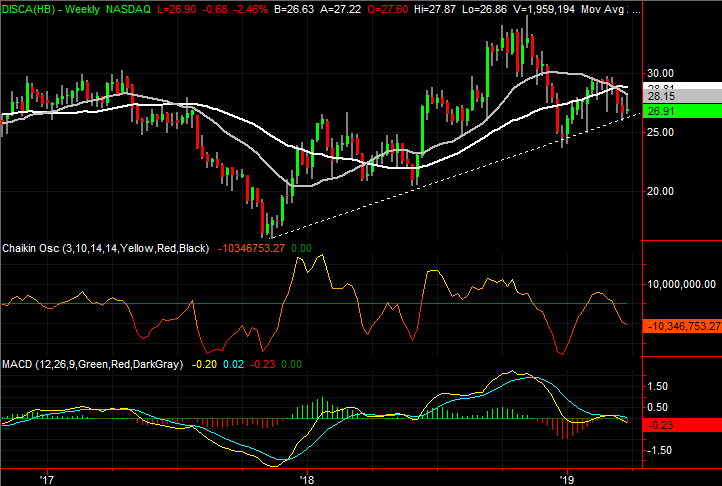
Discovery Communications (DISCA)
Early in the year it looked as if Discovery Communications was on the road to recovery. Like most names, it shrugged off the December stumble rather convincingly.
That effort petered out in February though, with DISCA stock bumping into a familiar technical ceiling. As of this week we’ve seen even more bearish clues take shape. One more bad day could push Discovery past the point of no return.
Click to Enlarge
• Also as of this week, the gray 100-day moving average line has broken below the white 200-day moving average line; the 50-day average is already below both levels.
• Should Discovery Communications shares break below the technical floor established around $26 since January, the bulls may be unwilling to even try and keep DISCA propped up.
• The stock’s also on the verge of breaking below a major support line on the weekly chart that’s tagged all the major lows since December’s bottom.
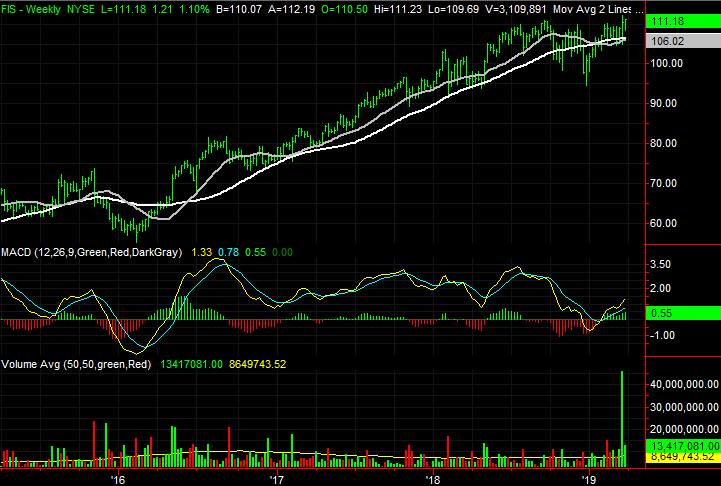
Fidelity National Information Services (FIS)
Finally, a week and a half ago Fidelity National Information Services was put under the trading microscope. Shares jumped to new 52-week highs in a big way, but that very same day the bears whittled that gain back down to a loss. The sudden intraday swing suggested a major pivot was taking shape. What wasn’t clear was which way that pivot would point once the dust settled.
As things have settled down in the meantime, it looks the bulls are taking charge. Though FIS sold off a few more days following that first look, shares have rallied firmly for the past few days, achieving their best close ever on Thursday.
Click to Enlarge
• Those buyers haven’t looked back either. As was noted, the bulls carried FIS to a new record close on Thursday, perhaps tipping their hand.
• Zooming out to a weekly chart of FIS was can see the setback suffered late last year may serve as a much-needed “reset” that ultimately sets up a prolonged move like the one seen over the better part of 2017 and 2018.
As of this writing, James Brumley did not hold a position in any of the aforementioned securities. You can learn more about James at his site, jamesbrumley.com, or follow him on Twitter, at @jbrumley.