Be wary of drawing any sweeping conclusions about any individual stocks based on Monday’s action. The market tide was so bearish that few names could escape the undertow. On the other hand, if the undertow is this bearish, it’s not as if many stocks will be able to overcome it.

Mega-cap Apple (NASDAQ:AAPL) did the most net damage, losing almost 6% of its value on concerns that it would be a key victim of the rekindled tariff war being waged between the U.S. and China. Fanning those bearish flames was a decision from the U.S. Supreme Court that app users can sue the company.
There were some winners, although few and far between. Recently-IPO’d Beyond Meat (NASDAQ:BYND) rallied another 5% as investors once again were willing to get behind the maker of meat alternatives.
Neither are great trading prospects headed into Tuesday’s action though. Rather, the stock charts of Coty (NYSE:COTY), NiSource (NYSE:NI) and International Paper (NYSE:IP) are shaping up as better, less erratic bets. Here’s a closer look.
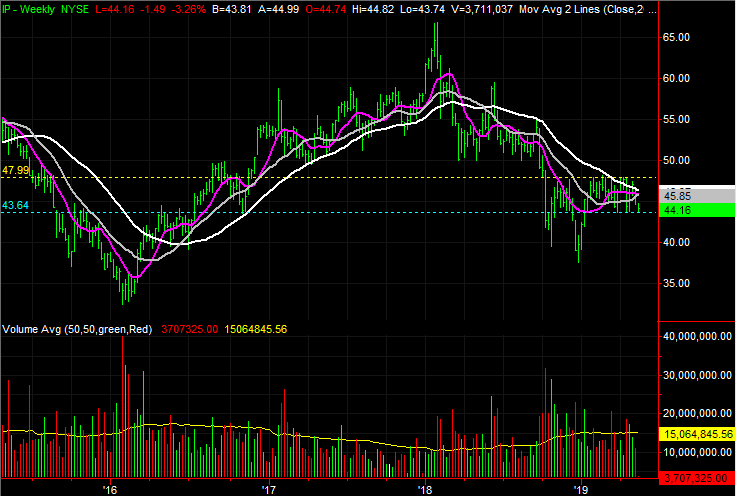
International Paper (IP)
More than once since February, International Paper has hinted of a breakout effort, only to wind up bumping into a ceiling. On the flipside, IP stock has for a third time since March found technical support at a familiar level.
While still technically range-bound, the pressure on the lower boundary continues to swell; meanwhile, other technical resistance levels are helping to take the pressure off of the rally efforts, guiding IP shares lower. One more misstep, in fact, could push International Paper over a proverbial cliff and open the selling floodgates. It looks as if the bears are ready to make that happen too.
Click to Enlarge
- The upper horizontal boundary is near $48, plotted in yellow on both stock charts. The lower floor is $43.70, plotted in blue, where IP has bottomed three times since March.
- Since early April, the white 200-day moving average line has also stepped in again as resistance. Those encounters are highlights on the daily chart.
- Zooming out to the weekly chart it’s easy to see that the bigger-picture downtrend that began early last year is still in place, and in motion.
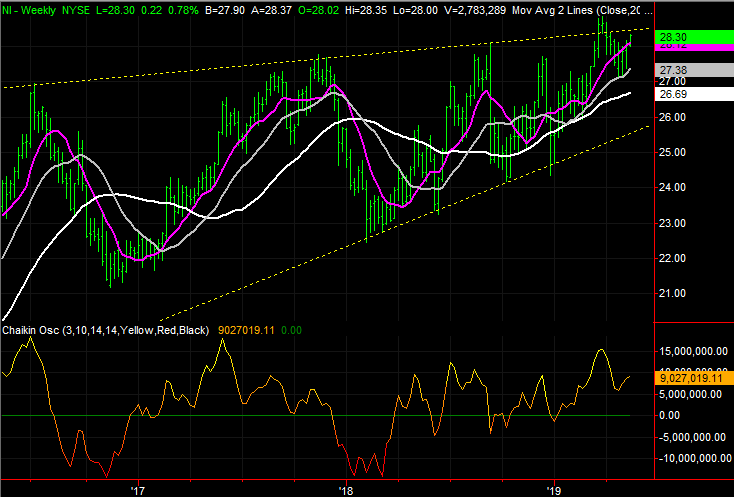
NiSource (NI)
It’s likely got more to do with the broad market’s weakness and the search for safety than it has to do with NiSource in particular. Nevertheless, the gains NI shares have demonstrated of late are a clue that traders are serious about rotating out of riskier names and into safer havens. Those trends, once in motion, tend to remain in motion for a while.
Besides, though volatile, NiSource is in a solid long-term uptrend anyway. A little more progress from here could shove the rally into an even higher gear.
Click to Enlarge
- An ascending wedge pattern is plotted in yellow on both stock charts. That converging support and resistance is forcing traders to make a decision, and in this case, the ‘squeeze’ has thus far been bullish.
- On the daily chart, NiSource is also back above a horizontal ceiling at $27.75. That line had also been support.
- While choppy, the volume behind the gain since early this year has been on reliable, growing volume. Traders may have had this move planned with or without weakness developing in other sectors.
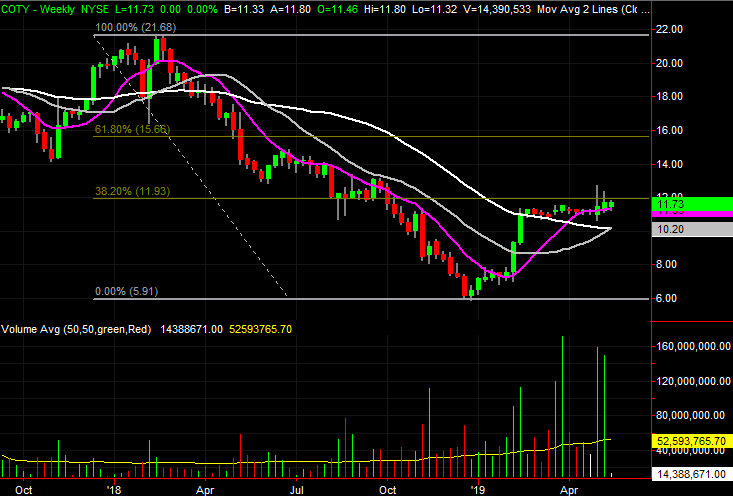
Coty (COTY)
Just because a stock wasn’t dragged lower on Monday doesn’t inherently make a bullish case for it. On the other hand, if a stock can hold its ground on a day like yesterday, it certainly doesn’t hurt a bullish case. That bullish thesis is made even stronger when support at key lines is confirmed.
That’s how things panned out for Coty yesterday.
In February, Coty stock shot higher in response to a quarterly earnings beat, and then shot higher again after JAB announced it was seeking to add to its controlling interest.
That offer was a key part of the reason COTY stock stagnated until early this month. Once the deal went through, Coty shares were able to start moving, and they have … bullishly. That strength was already been taking shape though, and the bulls have held their ground in an environment when they arguably shouldn’t have been able to. That persistence speaks volumes.
Click to Enlarge
- The purple 50-day moving average line and the blue 20-day moving average line acted as floor last week, providing a push-off point for yesterday’s strength.
- There was plenty of buying volume two weeks ago as well as last week, though it’s likely much of that was JAB’s interest.
- Whatever the reason, former ceilings at $11.28 and $11.60 have both been well cleared.
- There’s one final, mostly psychological line in the sand. The 38.2% Fibonacci retracement line lies at $11.93. If it’s hurdled as well, there’s little left to hold Coty shares back.
As of this writing, James Brumley did not hold a position in any of the aforementioned securities. You can learn more about James at his site, jamesbrumley.com, or follow him on Twitter, at @jbrumley.